When formalizing and implementing a performance management system (PMS) based on key performance indicators (KPIs), there are multiple activities to be considered and many stakeholders to be engaged in the process. Therefore, you’ll need a project plan to make performance management an ongoing process within your organization.
What matters most is not to have an extra process in place, but to do it right by connecting strategy formulation with strategy implementation and KPI across the organizational levels. The way you will design and implement the PMS based on KPIs will play a huge role in the way it will be perceived by the employees. This is exactly why our approach is based on a combination of analysis and research, workshops and feedback activities.
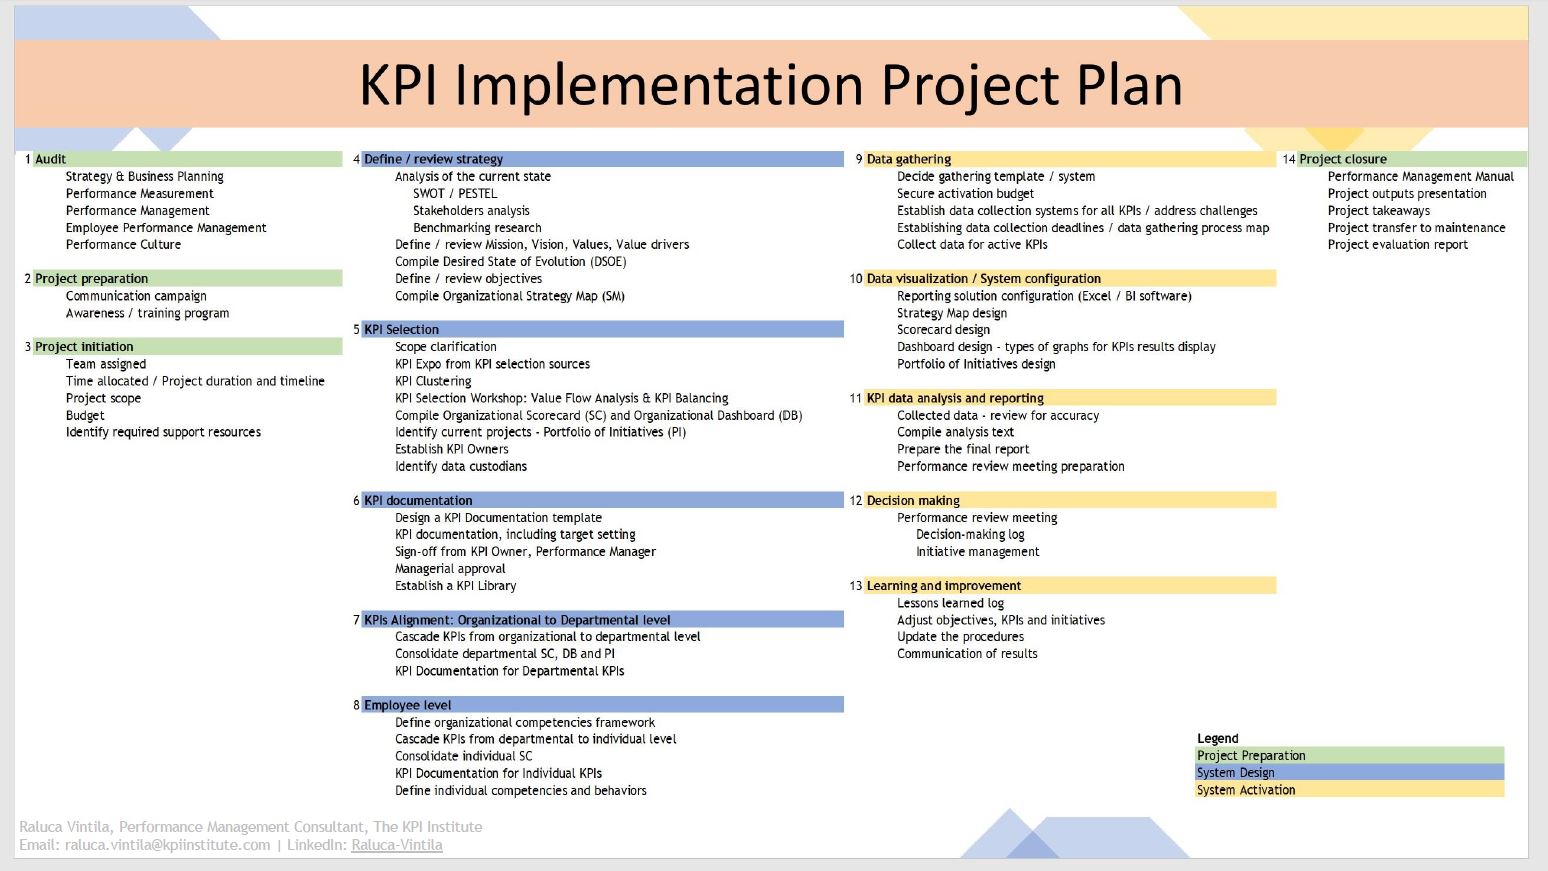
Zooming out, the proposed project plan includes 14 stages:
5 Stages: System Design
5 Stages: System Activation
4 Stages: Project Management
Zooming in, all 14 stages include major sub activities that indicate how granular this puzzle can be. A real image of efforts and resources engaged.
What are the key elements to ensure that a KPI implementation project plan will be a success story?
The differentiator in creating successful conditions is represented by the employees’ trust in the project. Why? Because change brings fear, and fear must be managed in connection to the implementation of KPIs.
Fear of becoming replaceable or unnecessary
Fear of unrealistic (too high) targets
Fear of extra work
As what I wrote in a previous article, if fears exist, then managers should consider looking for a course, training, or coaching session on how to guide their employees in managing their fears. Another step is to have an organizational message with a system that reinforces the organizational culture and the real intentions and effects of such a project, reassuring everyone that they will not be swept away by it.
Could this project be considered for departmental level only?
The KPI implementation project plan can be applied to the departmental level only. It has advantages and disadvantages Since this KPIs system is not a stand alone, the departmental level will ultimately get connected to the strategic (superior) and individual level (lower).
One advantage of this approach is the system will be founded on a strong understanding of operations and specific processes and developed at departmental (mid) level. Another advantage is increased involvement of employees in developing the system. This can generate a high sense of commitment and engagement based on their contribution.
Meanwhile, the disadvantage of this approach is that starting with the lowest level may not ensure a strategic orientation, and it may be predominantly narrow instead, given the limited understanding of the overall organization’s mid- and long-term commitments.
If you would like to learn more about KPI measurement and KPI implementation, sign up for The KPI Institute’s Certified Professional and Practitioner training course.
How does cascading KPIs to the individual level look like?
Performance management as a practice facilitates the long-term success of an organization, as it brings focus and clearly defines the organization’s identity and strategy, while ensuring resources are allocated towards what matters.
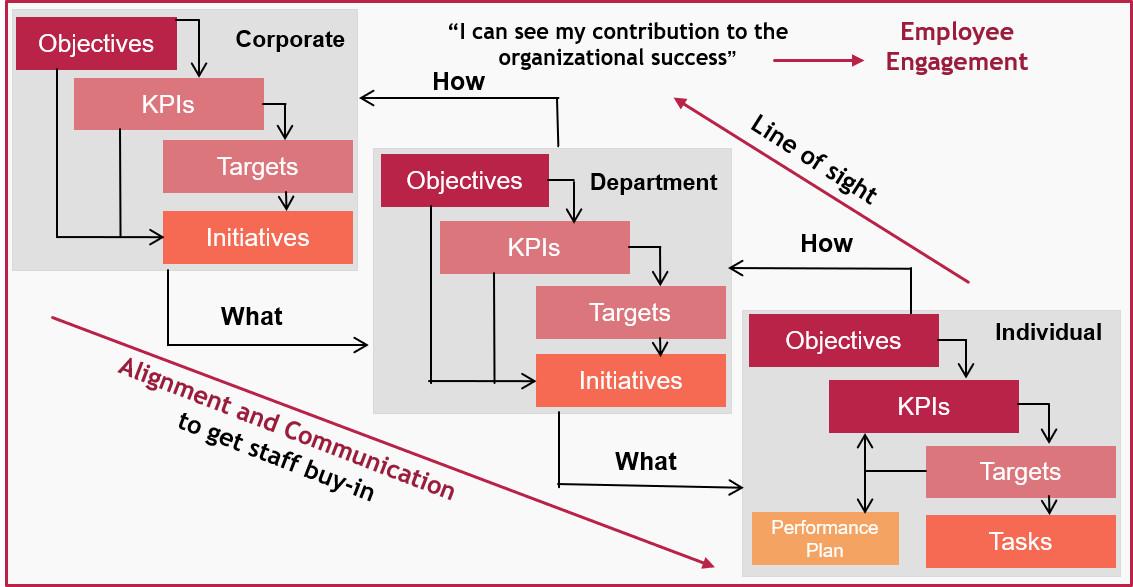
A structured performance management system enables alignment from the organization’s strategic direction towards its departmental key functions and individual priorities.
It ensures that strategic objectives are executed across all units and functions, while establishing relevant KPIs at each level of the entity. The cascading technique addresses the challenge of working in silos and drives cross-functionality and uniformity.
How do we cascade operational strategy to individual level?
Let`s take a look at an example of an HR Department.
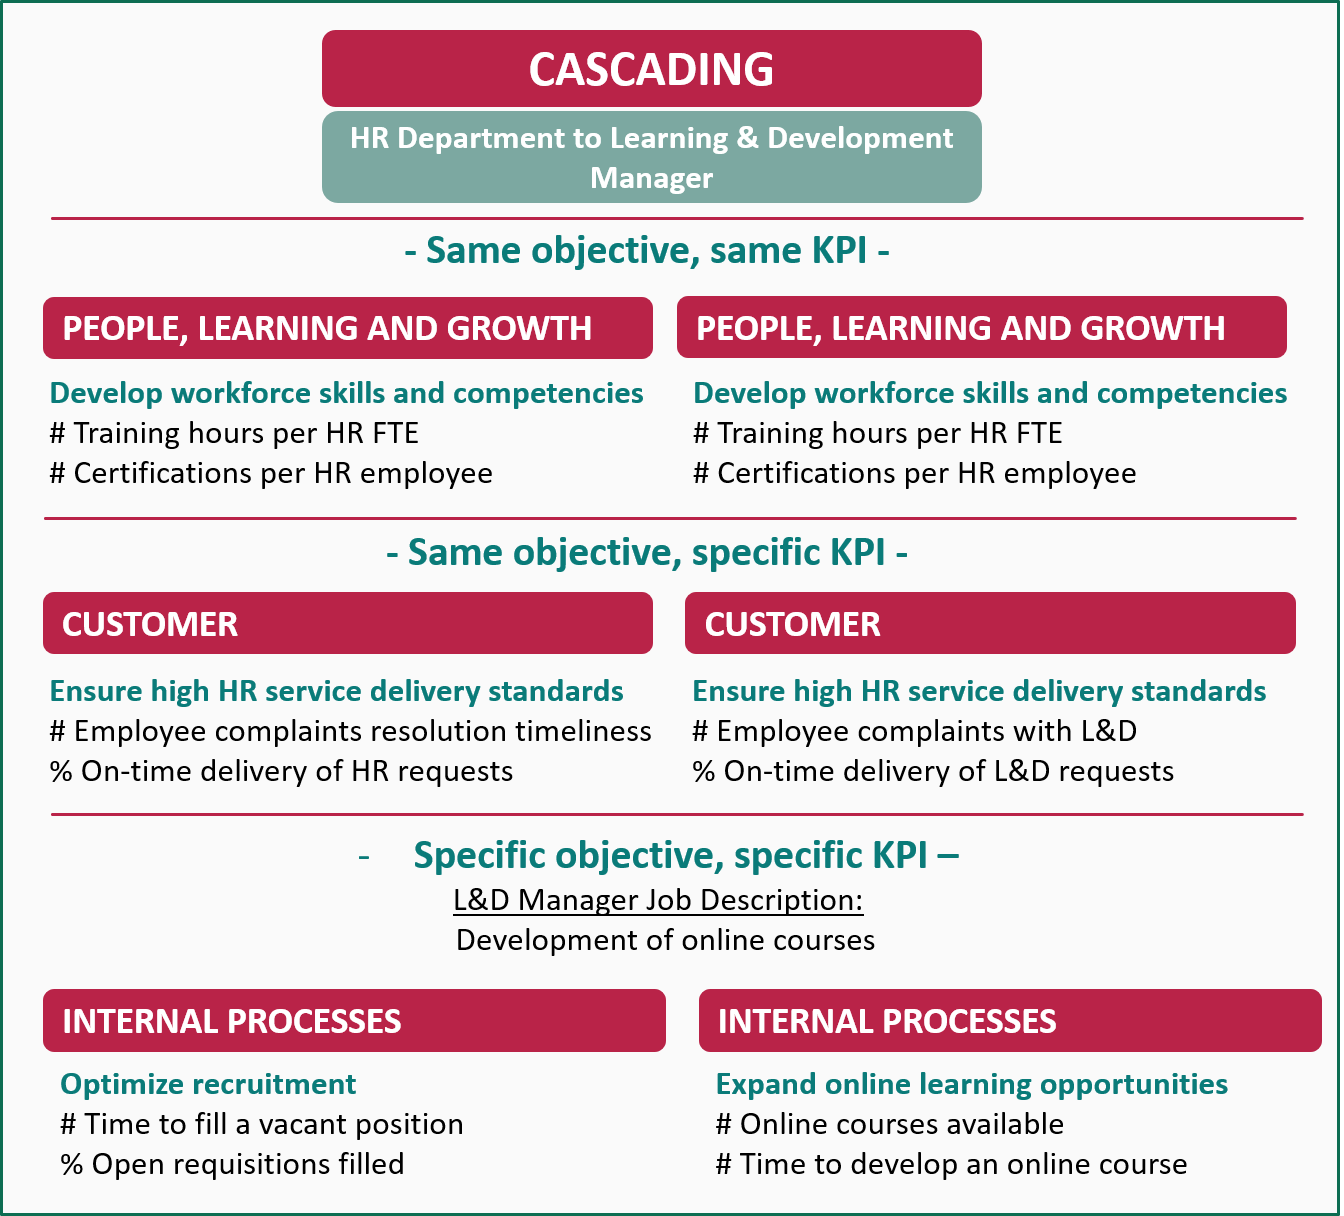
First, the same objective can be cascaded to multiple functions, each of them measuring it through different KPIs.
Second, department level objectives and KPIs can be cascaded and aligned at individual level either as they are, with the same or different KPIs:
Same objectives – same KPIs;
Same objective – specific KPIs.
Finally, some departmental objectives may not be applicable to cascade to lower levels; however, we can add specific objectives and KPIs based on the targeted employee’s job description.
SMART objectives
In terms of the quality of objectives, organizations must focus on developing SMART ones.
The SMART acronym is one of the most used phrases in business. It has its origins in the Goal Setting Theory school of thought and the Management by Objectives concept. The latter was introduced and popularized by Peter Drucker in 1954 through his book “The Practice of Management”. This approach aims to improve organizational performance by clearly setting and defining objectives/ goals agreed by both management and their employees.
Back in 1968, Dr. Edwin Locke published “Toward a theory of task motivation and incentives,” where he investigates the premise that conscious goals affect actions. His research and conclusions lead to four general principles designed to motivate and lead to best performance:
Goals should be challenging, however attainable.
Goals should be specific rather than vague
Employees should be part of the process of setting their own goals
Goals should be measurable and clearly understood
George T. Doran published a paper in 1981 called: “There’s a S.M.A.R.T. Way to Write Management’s Goals and Objectives.” Based on his proposal, a SMART objective should meet the following criteria:
Specific – target a specific area for improvement
Measurable – quantify or at least suggest an indicator of progress
Assignable – specify who will do it
Realistic – state what results can realistically be achieved, given available resources
Time-related – specify when the result(s) can be achieved.”
While there are many examples of objectives that are incompletely defined and don’t meet the SMART criteria, in the case of KPIs things are different. By their own nature and definition, KPIs are indicators of performance with the following inherent characteristics:
Specific – For the objective/ process/ functional area which it addresses;
Measurable – It has to be a metric, therefore it is required to be quantifiable;
Assignable – Ownership needs to be assigned to ensure achievement and improvement;
Realistic – Targets set for the KPIs need to be realistic, taking into consideration available resources, current baselines, benchmarks and market or industry trends;
Time-bound –Targets must have a predefined time, by which they should be achieved.
Consequently, a KPI shouldn’t even be called KPI if the smart criteria are not met. For this reason, the term SMART KPI is in a way doubling down on the SMART criteria.
Our recommendation is that we should not use the traditional approach to defining SMART objectives, but rather ensure that the objective is clearly formulated and easy to communicate. We will then ensure they are ‘SMART’ once we add the KPIs to our objective.
This involves decomposing the traditional approach to ensure clear linkage between performance management tools, concepts and roles such as KPIs, Targets and KPI Owners, thereby ensuring a clear understanding of the SMART criteria and its direct application in organizational contexts.
The Balanced Scorecard is one of the most important performance management tools used to improve business functions and their outcomes. This tool is used not only at the organizational level but also at the departmental level.
By using departmental scorecards, managers are able to get detailed insights into the performance of their departments. The scorecards can also determine the responsibilities of the employees in terms of achieving strategic objectives.
To implement an effective balanced scorecard for the departmental level, organizations should take into consideration these best practices.
1. Develop the right template.
Employees are often asked to collect data since every manager knows that it is essential in generating qualitative insights. However, the different performance reports could easily lead to different interpretations. A well-designed template leads to a clear, structured reporting and improves communication through standardization.
The template should contain four perspectives that meet the organization’s strategic needs. The most commonly used perspectives are Financial, Customer, Internal Processes, People Learning, and Growth.
Moreover, the template should also display the objectives associated with each perspective and the KPIs associated with each objective. For each KPI, the target and thresholds, the trend, and the previous and current result should also be presented.
2. Choose the right objectives.
When preparing a departmental scorecard, one of the most important steps is to select the right objectives for the different categories, and those objectives should align with the organizational and departmental strategy. Through the cascading process, the organizational objectives and KPIs are translated from the strategic level down to the departmental level.
The departmental scorecard must contain some specific objectives depending on the activities of the operations team. The same objective can be cascaded to more departments, each of them measuring it through different KPIs. Some organizational objectives may not be cascaded to lower levels.
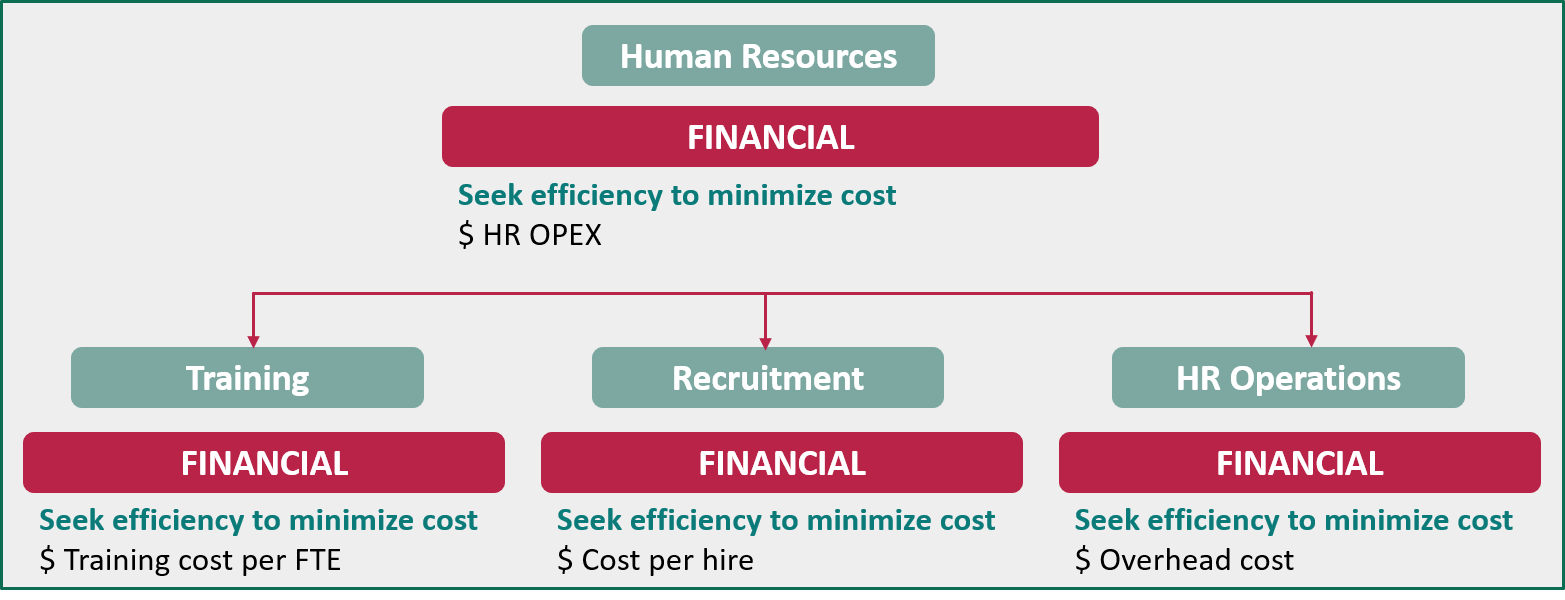
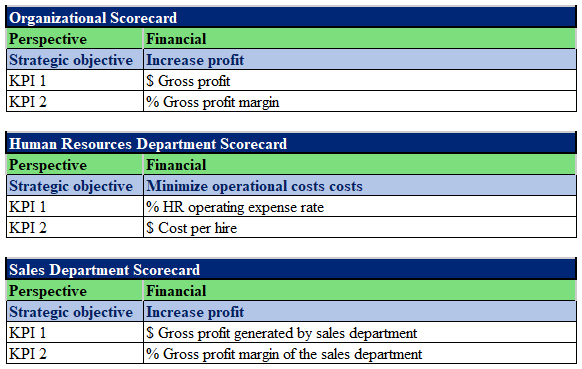
For example, the objective of the Financial perspective is to Increase profit. This organizational objective can not be directly cascaded to the human resources department since the human resources department has no direct influence on the revenue of the organization. However, they could reduce their spending in order to increase organizational profit. Therefore, the objective for the human resources department could be to minimize operational costs. Since the sales department is responsible for profit generation, they can cascade down this organizational objective without any modification.
Figure 1: Objective cascading example
3. Choose the right KPIs to measure the objectives.
As mentioned before, it is recommended not to cascade all objectives and KPIs from the organizational level to the departmental level, but organizations may add specific ones that represent the department. The most important attributes in KPI selection are relevance, clarity, and balance.
In many cases, organizational and departmental scorecards may not be enough to communicate the organizational strategy to all employees. Therefore, individual scorecards should also be created for them.
Data sources for a scorecard
During the scorecard development process, organizations may find it hard to determine the right objectives and KPIs. Objectives and KPIs must be based on relevant data. There are two types of sources of data to consider: primary and secondary.
Feedback from internal stakeholders can be considered as an internal primary data source, while feedback from external stakeholders is an external primary data source. Secondary internal sources could a company’s previous reports and strategy plans, while smartkpis.com and academic articles are external secondary sources.
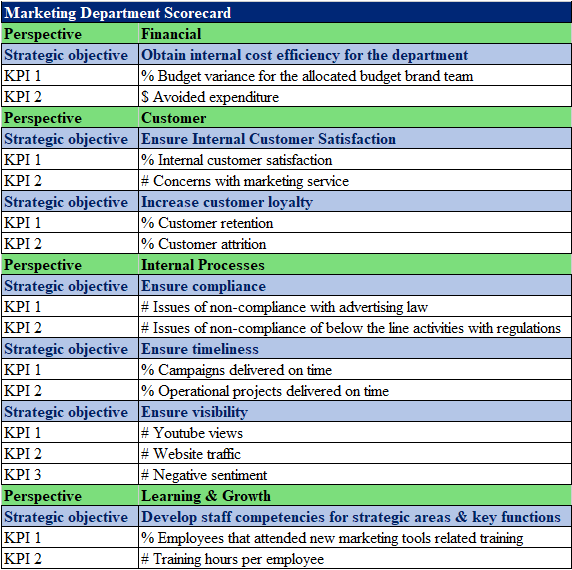
Figure 2: An example of a marketing departmental scorecard
Working in a team can create synergy, since a good team will likely produce better results than individuals working separately. However, measuring team performance is even more challenging than measuring the performance of each employee separately, since you have to take into consideration each and every member’s performance, in relation to the others’, as well as the overall team’s.
In general, employees are members of departments. A department is a subdivision of an organization and an individual, generally, can only be part of one department. That being said, nowadays, teams are more flexible in how they are formed and how they operate: a team can be a temporary group formed to work on a specific task or project. Therefore, employees can be members of only one department, but several teams.
The first step is to link the team results to the organization’s goals, by cascading the objectives and KPIs from the organizational level to the team level. It is not very productive to have a well-performing team whose work does not help the organization reach higher performance goals.
Key aspects of team performance measurement
There are many indicators and measurements that can be useful when considering measuring your team’s results. In what follows, we’ve put together a list of the most widely employed benchmarks, so that you may get a general feel for what is considered useful to keep track of.
Employee attendance: Employee attendance is an important aspect of team performance since absenteeism incurs excess costs and will have an unwanted effect on team productivity & employee morale.
Moreover, late employees can be the source of annoyance or frustration, which will reduce team cohesion and further reduce a working unit’s effectiveness. Therefore, attendance related KPIs should be the first ones to track, when we talk about team performance:
% Absenteeism: Indicates the percentage of employees within the team who are repeatedly and/or unexpectedly absent, out of the total team members.
$ Lost time accounting: Measures the potential revenue lost because of idle workers or wasted hours within the team.
# Time lost by starting work late: Measures the volume of time lost due to employees starting their working hours late.
Client satisfaction: Every team has an internal/external customer, which is why satisfaction can be a good measurement unit. Improving customer satisfaction will eventually result in a more efficient production process, better service and ultimately, lead to more satisfied external customers. The most important KPI to measure in this regard is the following:
% Customer satisfaction: Measures the level of satisfaction exhibited by the team’s customers (current employees, distributors, vendors, departments, or external clients), towards the inter-functional services provided, be it communication, productivity and/or responsiveness.
Employee retention within the team: A low retention level or a high turnover level is usually connected with low levels of efficiency and productivity, which in the end can lead to a negative impact on an organization’s overall results.
This aspect can be influenced not just by the team performance, but also by the HR department’s performance, the working environment and work policies, the supervisor, as well as the promotion and professional development opportunities for the future. However, high level of employee turnover within a specific team could indicate team-related problems.
The most important employee retention KPIs to measure are the following:
% Employee turnover: Measures the rate at which employees leave the team in a given time period (e.g., month, quarter, year).
% Employee retention rate: Measures the total number of employees retained at the end of the reporting period, expressed as a percentage from the total number of employees that were in the team at the start.
Employee satisfaction: Studies suggest a direct correlation between employee satisfaction, employee engagement and increased performance. Employee engagement can be increased through various company efforts, such as facilitating the development of skills for its employees, giving them a sense of trust and integrity, and clarifying their opportunities for future career development. The most important indicators to take into consideration, when looking to improve or maintain employee satisfaction, are the following:
% Employee satisfaction: Measures the employees’ satisfaction and motivation level, with aspects regarding their job and working environment: job responsibilities, team and management, workplace, and professional development.
# Employee Engagement Index: Measures the engagement level of employees in their work activities and responsibilities, in terms of enthusiasm, commitment and discretionary effort.
Productivity of individuals: Productivity of individuals is a key element of team performance. The following KPIs help measure a team’s contribution to the organizational goals, and the contribution of its members to the general team results:
$ Profit per employee: Measures the team’s contribution to the overall profit pool. It is a particularly important ratio in customer-focused businesses, such as those in the service sector.
$ Sales per employee: Measures a team member’s productivity and efficiency in generating sales.
% Human Capital Return on Investment (ROI): Measures the return on investing in a team’s human capital, after adjusting for the cost of financial capital.
$ Human capital value added: Measures the value added through productive activities, by a team’s members. Reflects the adjusted operating profitability figure, calculated by subtracting all expenses except for labor expenses, from revenue, and dividing the adjusted profit figure by the total headcount.
OKRs or KPIs?
In some specific cases, where the productivity of a team is not directly linked to the organizational revenue or profit (ex. support teams), it is more advisable to use OKRs (Objectives and Key Results), instead of KPIs (Key performance indicators), to measure productivity.
OKRs contain a well-defined objective and one or more key results. OKRs help define how to achieve a goal through concrete, measurable actions. So, in case of the support teams, these results should be measured to track team performance, as they will be able to paint a more accurate picture of their efforts.
Conclusion
It is a complex process to measure team performance; therefore, it should be analyzed from numerous angles, according to each team’s specialization and workload. It should be noted that the aforementioned indicators are not the only ones which can portray a group’s results. However, if you are looking for a quick introduction into this topic, these KPIs will serve as a sustainable foundation on which you can build your employee management system.
Project management is no longer just viewed as an end-to-end process, but it is also an area in which skills are in high demand. The Project Management Institute’s “Pulse of the Profession” report shows that senior management increasingly places a high value on project management.
It is also becoming a new culture for nearly half of the organizations. Meanwhile, those who do not consider project management a strategic competency posted 67 percent more of their projects failing.
Today, project managers are compelled to think more strategically as they adapt to the uncertainties brought by the pandemic. That’s on top of dealing with multiple stakeholders and changing market dynamics.
For instance, construction companies and laborers face new disruptions as they execute their projects. A report from Markets and Markets highlights the growing awareness about antibacterial construction materials, volatility in raw material prices, and changes in the supply chain particularly for the residential construction sector.
Given the ever-changing business landscape, how can organizations manage projects successfully and get the most out of their teams to meet deadlines, achieve high productivity levels, and drive results?
They can start with selecting and using the right Key Performance Indicators (KPIs) to achieve clarity, focus, and improvement as they go through the stages and elements involved in managing a project.
Why use KPIs in project management?
A KPI expresses the achievement of the desired level of results in an area relevant to the evaluated entity. In terms of project management, KPIs mirror the quality of the implementation processes, quantitative outputs, and project outcomes.
Based on a survey of over 200 contractors and trade professionals conducted by Dodge Data and Analytics and commissioned by the software company Autodesk, contractors can obtain data by employing digital technology to manage projects, but they do not have a system to process their information and utilize it meaningfully. Having identified the most useful KPIs in the field to interpret overall performance, the study concludes that “by adopting specific processes for project management, contractors can reduce risk, thus minimizing downstream problems and improving performance.”
KPIs are applicable across multiple industries and functional areas. However, they are not the same for every industry or for every company. They are selected based on an organization’s environment, activities, and objectives. You can sign up for the live online course offered by The KPI Institute to learn how to implement a KPI Measurement Framework in your organization.
To give you an overview of the KPIs used in project management, the Top 25 Project Management KPIs – 2020 Extended Edition presents the most viewed KPIs based on the information from smartKPIs.com, a database of over20,000 documented KPIs.
The top 25 KPIs belong to four crucial facets of project management:
Project Budget involves the number of resources allocated to the project.
% Project budget variance
% Project or program budget spent on training
$ Project budget size
Project Assessment refers to the reviewing process of the development of projects and their outcomes.
% Project resource utilization
$ Profit per project
# Cost Performance Index (CPI)
# Project issues addressed ratio
% Requirements changed during project execution
% Project budget overruns rate
# Projects issues identified
# Projects per project manager
$ Project cost savings from innovation
Project Timeline relates to the use of schedules or charts used to plan and subsequently report project progress.
% Overdue project tasks
% Project milestones missed
% Project schedule variance
# Requests for time extension submitted
% Time spent on new projects development
$ Estimate at Completion (EAC)
% Delivery deadlines met
# Time per project task
# Project delay
% Timely production of management reports
% Project completion predictability
Project Team Performance refers to the performance that meets the needs and expectations of company colleagues.