The term “high-performance” implies that the team’s performance is measured and either meets or exceeds expectations. Thus, for organizations seeking objective measurement and the precision necessary for informed decision-making, having a strong data analytics framework is indispensable. One of the most practical applications of this is the use of key performance indicators (KPI) dashboards to track progress and align efforts.
Before developing a KPI dashboard, it is important for organizations to first understand how goals are set, including the processes, roles, and considerations involved, as these form the foundation for effective measurement and improvement.
Analytical Goal Setting
Step 1: Defining High Performance
The first step to achieving high performance is to define it. This is done by setting specific objectives for your company, team, and team members. This process is usually top-down for most businesses, meaning top management defines the company-wide goals first and then cascades them down the totem pole.
Let’s take a small marketing consultancy firm as an example. The firm’s top management may define high performance as achieving a 10% year-over-year growth in revenue. Achieving this target means the company is high-performing.
Step 2: Identifying Key Processes
At this point, everyone in the company should already understand what management sees as high performance. However, what does high performance mean for individual teams? They must understand what they can specifically do to help the company achieve high performance.
Let’s continue with our marketing consultancy example. If the company aims to achieve 10% year-over-year growth in revenue, here is how each department can contribute to this goal.
The marketing team can work on increasing the number of generated leads.
The sales team might implement new strategies to upsell current and old clients. They can also train the salespeople to increase the conversion rate of leads into customers.
The finance team can collect invoices from customers faster, leading to higher reported revenue and lower bad debt.
The client services team can work on increasing customer satisfaction, therefore retaining clients for longer.
If every team member understands which of the processes they can influence, then they can all work together to achieve high performance. This clarity around goals and processes forms a critical part of the overall data analytics framework, ensuring that every metric tracked later truly reflects business priorities.
It can be tempting to set targets for each team member related to every process. However, achieving high performance does not come from setting aggressive targets alone. This is something that Richard Rumelt talks about in his book Good Strategy/Bad Strategy. In the book, he states that growth targets should be justified by:
A wider industry growth
A new product/service that a company launches
An improvement in a current business process
New source of leads
For example, before the sales team commits to a 10% year-over-year increase in sales to existing clients, management should decide what exactly will contribute to this growth:
Is this in line with the wider industry trend? If so, management should define specific strategies for how the sales team could capitalize on it.
Did the company launch a new product? If so, management can work together with the sales team to identify new upsell opportunities.
Does the sales team need more capacity for the sales process? If so, management can hire an additional salesperson.
Are there any salespeople who have better conversion rates than others? If so, management can train the other salespeople based on the best practices of high achievers.
Essentially, the whole team needs to agree on what specifically would drive business growth. Once this is done, management will be able to identify specific tasks and start assigning them to team members.
Data Analytics
Step 4: Determining KPIs
Once the process is identified and broken down into tasks, there are two types of key performance indicators (KPIs) that the team needs to measure:
How tasks are being completed
The output of the process
For example, here are the KPIs that measure how effectively the sales team is following the process:
# Prospecting calls to existing clients per month
% Clients contacted with new offers
# Demos to existing clients
Measuring and tracking the team’s performance based on these KPIs can help identify any potential problems in the execution process.
The company should also identify KPIs that measure whether the new process is productive, such as:
# Sales closed
$ Additional revenue
% Conversion rate from prospecting calls to demos
These KPIs can help the company understand if the process is bringing the desired results to the business. If not, the company may need to re-engineer the process or pivot toward a different one altogether.
The final step is to set targets based on every KPI. This will set performance expectations for every team member and ensure clarity on how their performance is measured.
Step 5: Developing KPI Dashboards
KPI dashboards help management keep their finger on the pulse of the company by providing the latest updates based on identified KPIs. The process of building these KPI dashboards involves:
Extracting the data needed to calculate these KPIs
Visualizing this data by using business intelligence (BI) services like Power BI or Tableau
Refreshing the data in these dashboards either manually or automatically
Using BI tools to build KPI dashboards enables businesses to automate their reporting process, which makes it easy to refresh the dashboards every day. By having almost real-time reporting, management can quickly identify if the process needs to be optimized and which part of the process is responsible for underperformance.
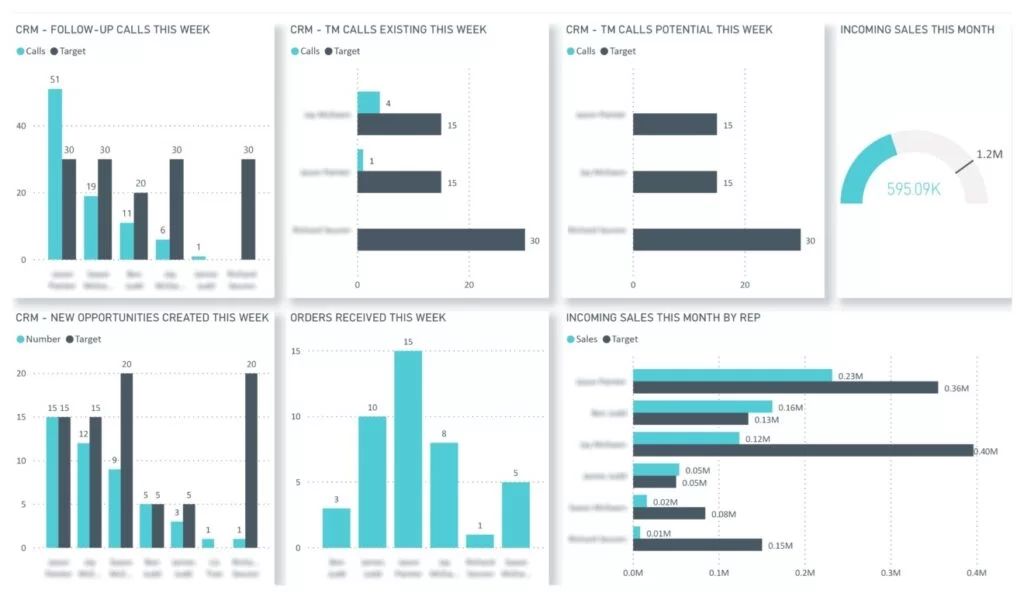
For example, the CRM KPI dashboard (see Figure 1) analyzes the performance of every sales representative within a team based on their activity metrics. Notice how there are targets for every sales activity KPI and for each team member.
Many companies also choose to share these KPI dashboards with every team member so that everyone knows their performance and how it compares with others in the team.
Sharing KPI dashboards with the whole team is impactful for several reasons:
Every employee understands which KPIs are used to measure their performance.
Everyone is clear at all times whether they are on track to hit their targets.
Team managers can identify high performers and team members who need the most help.
However, creating data analytics reports alone is not going to drive high performance. Data analytics reports simply improve the management of business processes, which can lead to higher performance.
It is also important to note that working to achieve certain targets can be quite stressful for the team. A good practice is for management to take a helpful stance on achieving targets by supporting team members when they need it, instead of putting more pressure on them when their performance lags.
**********
Editor’s Note: This article was written by Eugene Lebedev, managing director of Vidi Corp, a UK-based data analytics consultancy. He has delivered over 1000 data analytics solutions for more than 600 international clients, including Google, Teleperformance, and Delta Air Lines.
Productivity is a measure of the efficiency of production, expressed as the ratio of output to inputs used. Performance is defined as the accomplishment of a given task measured against preset standards of achievement, such as accuracy, completeness, cost and speed.
In the wider context of performance management, productivity is measured against productivity KPIs. In their simplest form, productivity KPIs, such as # Units per man-hour, stand at the basis of both modern and older performance evaluation systems. However, it is only but natural that we ask ourselves the following question: How much productivity is there left to both measure and reflect on performance?
In her book, The Measurement Nightmare: How the Theory of Constraints Can Resolve Conflicting Strategies, Policies, and Measures (1999), Debra Smith talks to her readers about a real-life situation, based on one of the most common productivity KPIs in use: # Units per man-hour. And it all starts with defining the KPI. According to her, # Units per man-hour is a “summary of standard costing’s use of standard labor hours and standard labor rates, resulting in labor variance analysis and decisions designed to improve.”
“There is not one productivity indicator that does not reflect on performance. And there is not one neglected faction of performance that does not impact productivity in one way or the other.”
From here on, Debra Smith describes this particular situation in which, on an intuitive basis, some executive manager from a manufacturing company decides to increase # Units per man-hour by cutting labor costs with highly automated machines. So, instead of six loom operators, four were assigned to tend to one loom per shift.
And the effect was as expected…at first. # Units per man-hour had increased at the loom. However, because of the downtime of the looms which now increased, the total output of the looms had decreased.
Due to a lack of attending operators, the downtime of the machines escalated up to a point where it impaired all subsequent processes. When that happened, all downstream processes began to suffer from starvation. % On-time delivery of products declined, $ Labor costs went up due to # Overtime and, instead of going up, $ Net profit went down.
Debra Smith’s account of the negative side effects one productivity measure can propagate, when taken out of the context of performance, stand to show that there is more to productivity in performance than counting outputs per unit of input. And this is more visible when dealing with the most popular dimension, which is labor productivity.
In the context of performance management, labor productivity can be translated through individual KPIs. When dealing with employee performance, individual productivity KPIs become part of a more complex performance evaluation system. The overall individual performance index simulates an average between the score of the individual performance scorecard, the individual competencies score, and the employee behaviors score.
Where do KPIs fit into this equation? Productivity KPIs are mindfully incorporated into the individual performance scorecard, to best reflect the quantitative aspects of employee performance. And this is where everything gets tricky and we start asking ourselves: How much of one employee’s performance should be measured in terms of quantity?
Image Source: Freepik
Let’s take, for example, the automotive industry. With automotive manufacturing, productivity is a key performance indicator that measures the total production volume of the actual manpower, while taking into consideration the effective days officially scheduled for each automobile.
The core performance indicator of the automotive industry is # Hours per unit or # HPU, and it reveals the number of hours required to build a car. However, at its basis, this # HPU cannot be measured outside # Available manpower, # Effective working time, and # Individual production volume. Let’s add % Absenteeism rate to this reasoning.
When dealing with target production volumes it is important that the plant works at its full throttle to achieve those targets. Given this requirement, % Absenteeism rates should not be overlooked, as they have a major impact on the # Effective working time, which here on, impacts the # Production volume, and, ultimately, the # HPU.
However quantifiable, % Absenteeism rates also reflect on less quantifiable variables. This further takes us to the issue of % Employee engagement: a roughly quantifiable, uncontrollable driver of not only productivity but of performance as well.
So, how much productivity is there left, to both measure and reflect on performance? A great deal. And maybe the best way to look at it is by envisioning this revolving cartwheel…this continuous circle, which turns productivity into performance and vice versa.
All things considered, there is not one productivity indicator that does not reflect on performance. And there is not one neglected faction of performance that does not impact the former in one way or the other.
For more articles on productivity improvement, click here.
**********
Editor’s Note: This article has been updated as of September 18, 2024.
The Balanced Scorecard (BSC) is one of the most important performance management tools used to improve business functions and their outcomes. This tool is used not only at the organizational level but also at the departmental level.
By using departmental scorecards, managers are able to get detailed insights into the performance of their departments. The scorecards can also determine the responsibilities of the employees in terms of achieving strategic objectives.
To implement an effective balanced scorecard for the departmental level, organizations should take into consideration these best practices.
Develop the Right Template
Employees are often asked to collect data since every manager knows that it is essential in generating qualitative insights. However, the different performance reports could easily lead to different interpretations. A well-designed template leads to a clear, structured reporting and improves communication through standardization.
The template should contain four perspectives that meet the organization’s strategic needs. The most commonly used perspectives are Financial, Customer, Internal Processes, People Learning, and Growth.
Moreover, the template should also display the objectives associated with each perspective and the KPIs associated with each objective. For each KPI, the target and thresholds, the trend, and the previous and current result should also be presented.
Choose the Right Objectives
When preparing a departmental scorecard, one of the most important steps is to select the right objectives for the different categories, and those objectives should align with the organizational and departmental strategy. Through the cascading process, the organizational objectives and KPIs are translated from the strategic level down to the departmental level.
The departmental scorecard must contain some specific objectives depending on the activities of the operations team. The same objective can be cascaded to more departments, each of them measuring it through different KPIs. Some organizational objectives may not be cascaded to lower levels.
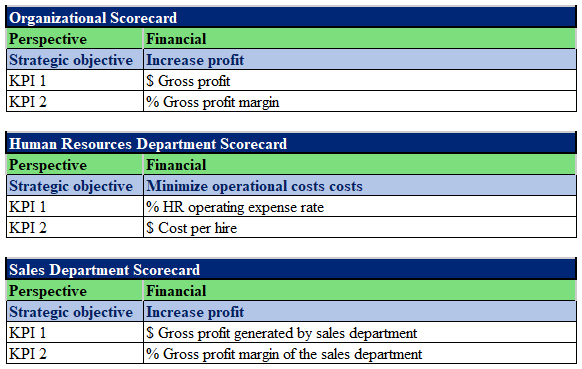
For example, the objective of the Financial perspective is to Increase profit. This organizational objective can not be directly cascaded to the human resources department since the human resources department has no direct influence on the revenue of the organization. However, they could reduce their spending in order to increase organizational profit. Therefore, the objective for the human resources department could be to minimize operational costs. Since the sales department is responsible for profit generation, they can cascade down this organizational objective without any modification.
Choose the Right KPIs to Measure Chosen Objectives
As mentioned before, it is recommended not to cascade all objectives and KPIs from the organizational level to the departmental level, but organizations may add specific ones that represent the department. The most important attributes in KPI selection are relevance, clarity, and balance.
In many cases, organizational and departmental scorecards may not be enough to communicate the organizational strategy to all employees. Therefore, individual scorecards should also be created for them.
Data Sources for a Balanced Scorecard
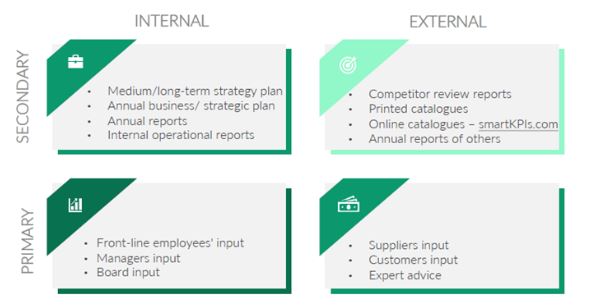
During the scorecard development process, organizations may find it hard to determine the right objectives and KPIs. Objectives and KPIs must be based on relevant data. There are two types of sources of data to consider: primary and secondary.
Feedback from internal stakeholders can be considered as an internal primary data source, while feedback from external stakeholders is an external primary data source. Secondary internal sources could a company’s previous reports and strategy plans, while smartkpis.com and academic articles are external secondary sources.
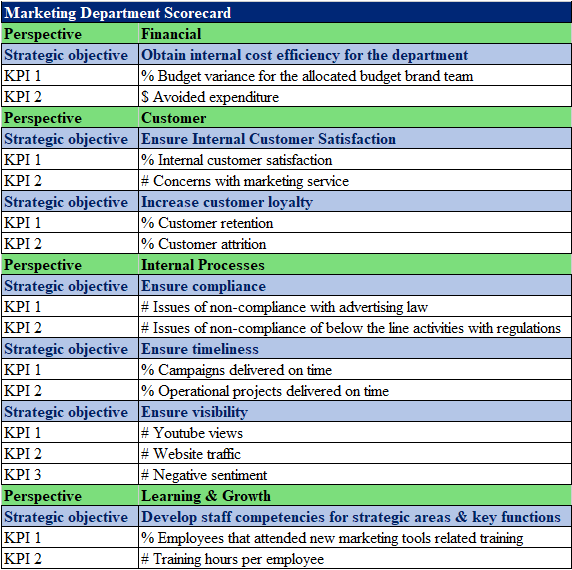
Figure 2: Marketing Departmental Scorecard Example
“What constitutes a good KPI example?”, “How should KPIs be measured?”, “Which KPI is suitable for our organization?”, and “How well will employees understand and participate in tracking these KPIs?” These questions often loom large for companies seeking to select the right KPIs to accurately measure their performance and progress toward strategic objectives.
According to The KPI Institute’s (TKI) State of Strategy Management Practice Global Report – 2023, choosing the right KPIs ranks as the second most significant obstacle in strategy planning.
The report further reveals a concerning trend regarding the challenges associated with working with KPIs. Results indicate a surge in the hurdles associated with KPI selection compared to the previous year.
Several factors contribute to the challenging nature of KPI selection, including the need to align with strategic objectives; the common practice of defining initiatives before KPIs rather than defining KPIs and targets first and then developing initiatives to reach them; clearly differentiating between strategic and operational KPIs at the departmental level; and focusing too much on task-related KPIs rather than impact KPIs at the employee level.
3 stages of KPI selection
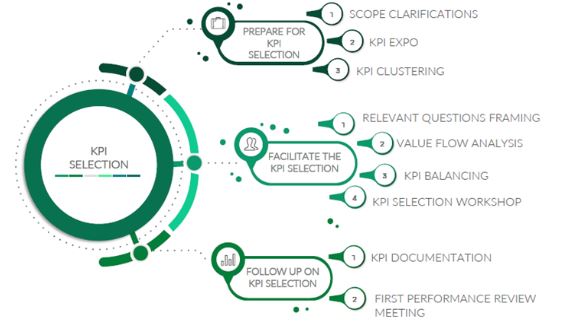
Selecting the right KPIs requires careful planning, analysis, and collaboration across various organizational areas. A rigorous KPI selection process typically involves three major stages (see Figure 1).
Your initial step in the process is to set a clear direction for KPI selection by recognizing the business objectives and goals that must be attained. This is essential to ensure that all personnel are working towards the same objectives and that progress can be efficiently monitored. This stage clarifies the necessity and application of measurement while precisely defining the intended purpose of the KPIs.
Next, conduct thorough research to gather a range of KPI examples. This serves a dual purpose: educating your internal stakeholders and fostering meaningful discussions about KPIs. This process, labelled as the KPI expo, entails compiling a comprehensive list of KPIs that will later be filtered based on a set of criteria.
You should review both internal and external data sources (see Figure 2) to leverage existing practices while also gaining insights into industry best practices. The KPI expo can include existing KPI lists from various organizational levels, which may already be in use or have been tested within your organization.
In the next stage, use intelligence gathering and conduct workshops to identify suitable KPIs. You can obtain insights from a diverse range of stakeholders, including clients, suppliers, employees, and management. This approach will foster broader buy-in and support.
TKI recommends the following selection methods to ensure the identification of relevant KPIs:
Question framing: Guide discussions toward relevant contexts and gather participant perspectives. Questions might include, “How many KPIs should we select?” or “What is the procedure for validating the selected KPIs?”
Value flow analysis: Examine the flow of value within business processes—from inputs to outcomes—to understand how objectives can be measured from different perspectives.
KPI balancing: Avoid narrow perspectives by selecting at least two complementary KPIs per objective, ensuring the measurement of both quantity and quality, subjectivity and objectivity, and efficiency and effectiveness.
Additionally, among the existing criteria in practice, TKI suggests using these five to ensure KPI relevancy:
Measurable: Can the KPI result be quantified?
Accessible: Can your organization feasibly gather the necessary data?
Specific: Does the KPI address a specific issue you have?
Actionable: Does it provide information for decision-making?
Balanced: Does it reflect various facets of performance?
The final stage in the KPI selection process involves monitoring the selected KPIs for necessary recalibrations. This can be achieved through two key activities: KPIs documentation and the performance review meeting.
KPI documentation can reveal limitations associated with data collection or reporting and gaps in the cost-benefit analysis of the KPI’s usage. Develop a comprehensive set of information for each selected KPI to facilitate data collection, reporting, and analysis.
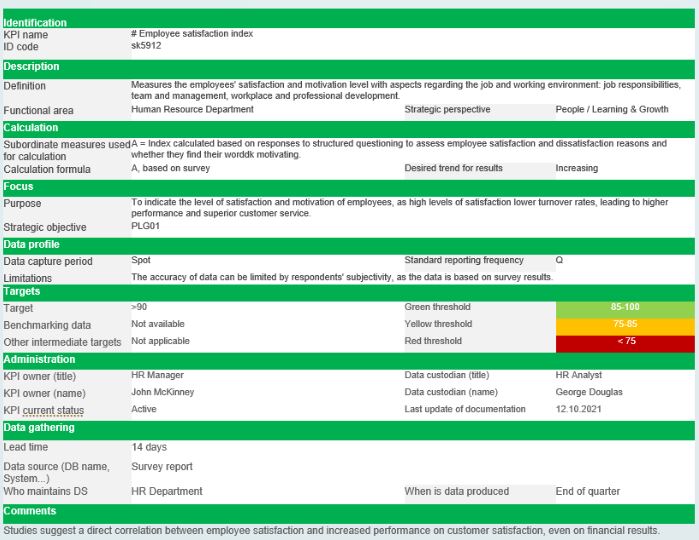
Use a standard template, known as a KPI documentation form (see Figure 3), capturing each KPI’s details, definition, calculation formula, target, data source, reporting frequency, KPI owner, and data custodian. For more examples, you can explore TKI’s comprehensive repository of KPIs at smartKPIs.com.
The first reporting and performance review meeting for the new KPIs will reveal their utility for decision-making. It provides managers with an overview of how the KPIs cover all aspects of the business and helps identify necessary adjustments to the corporate scorecard, ensuring that the most relevant data is available for decision-making. Facilitate this first meeting through your strategy office.
After this final stage, your KPIs can be maintained as initially selected, recalibrated and updated, or even phased out of use based on their effectiveness and relevance to your organizational goals.
By following these stages, you can select and implement KPIs that accurately measure performance and support strategic objectives, ultimately driving your business success and growth.
Ready to take your KPI selection to the next level? Head over to the KPI section on our website for more in-depth articles and expert advice.
Key performance indicators (KPIs) have been the north star guiding business strategy for decades. These criteria measure not only sales and revenue but also customer satisfaction as well as employee engagement.However, as the business landscape continues to evolve at an unprecedented pace, the need for deeper insights and more agile measurement arises. This is where the potential of generative artificial intelligence (GenAI) shines, opening doors to a new era of KPI innovation.
GenAI goes beyond automation to produce entirely novel content. It is a creative catalyst, opening up unprecedented possibilities for KPI innovation. Forget rigid, one-dimensional metrics. Powered by GenAI, KPIs become fluent, adaptive, and poetic, capturing not only the whats but also the whys and what-ifs.
Reimagining KPIs for exponential growth
From static to dynamic: GenAI is capable of integrating dynamic KPIs, meaning they can evolve alongside the company that uses them. KPIs also fit seamlessly into a changing market, with trends and strategies naturally shifting along the way.
Unveiling the unseen: Traditional KPIs often fail to hit the nail on the head by overlooking key, intangible factors that could affect performance. GenAI, however, can delve much deeper. With the help of GenAI, it is possible to determine brand sentiment before a particular campaign is launched, anticipate employee engagement within remote teams, or even predict customer turnover before it happens.
Personalized insights, enhanced action: Data mountains no longer need to be intimidating.GenAI transforms data into personalized narratives, crafting stories tailored to individual stakeholders. Sales teams can access actionable insights, marketing managers can monitor real-time customer sentiment, and CEOs can explore what-if scenarios for strategic foresight. This data-driven storytelling fosters informed decision-making and ignites action across the organization.
A practical guide to unlocking GenAI’s potential for KPI innovation
To effectively utilize GenAI tools like Gemini and ChatGPT for KPI innovation, follow these guidelines:
Define goals and challenges: Clearly articulate objectives, whether uncovering customer sentiment or anticipating market shifts.
Frame specific prompts: Use concise prompts such as “generate potential KPIs for measuring brand sentiment on social media.”
Provide relevant context: Enhance responses by furnishing background information about your industry, business model, and existing KPIs.
Experiment and refine: Iterate prompts, rephrase questions, and provide feedback to improve AI understanding.
Collaborate with experts: Involve human expertise in evaluating and implementing AI-generated insights.
While GenAI’s potential for KPI innovation is undeniable, it thrives on synergy, not substitution. The point is this: human guidance is essential. Act now, invest in your future, and become a master of the new KPI era by enrolling in The KPI Institute’sCertified KPI Professional course.