The case below explores the implementation of a standardized Operational Deployment System (ODS) at Corewell Health West, a healthcare system in West Michigan. The goal of the system was to align operational processes and improve efficiency across physician and non-physician stakeholders. By implementing ODS, the organization aimed to enhance quality, increase patient satisfaction, optimize operational efficiency, and reduce costs while ensuring staff and physician satisfaction.
The authors are Aiesha Ahmed MD, MBA (VP, Population Health, and Chief of Neuroscience); Rashelle Ludolph (Operations Director, Medical Specialty Services); Cheryl Wolfe MD, MBA (VP, Chief of Women’s Health), and Sonja Beute (Director of Strategic & Operational Deployment).
Background
Corewell Health West is a complex large healthcare system in West Michigan with 31,000 employees (4600 providers). Due to its large footprint in West Michigan, it aims for transformation to improve quality, increase patient satisfaction, deliver operational efficiency, and reduce costs. Foundational to all this work is staff and physician satisfaction. There was a need for shared language to communicate critical goals in a way that allowed us to be efficient while creating a standard approach to work. To move such a large team in one coordinated direction, Corewell Health needed to engage in focused efforts in a way that was respectful to its teams and leaders.
The Operational Deployment System (ODS) was designed to help leaders clarify what is most important and align the right resources to meet the goals set. This system, composed of best practices from individual project management and process improvement methodologies, was implemented to provide clarity, cascade goals appropriately, and help prevent employee burnout by creating a system of intentional alignment.
ODS implementation process
ODS begins with an annual goal-setting process led by the executive team and subject matter experts in the areas of cost, quality, people, and value. There is then a multi-week process of cascading these goals from the executive team through various levels of physician and operational leadership to front-line staff. Subsequent conversations called “catch-ball” follow in which each level of leadership discusses and eventually finalizes goals in each of the four categories. This process culminates with executive sign-off, confirming the roll-up of goals at each level to ultimately achieve the system goals. These goals are captured in a document called an Operational A3 (see sample). Each level of leadership, starting at the director level, has an OA3 that outlines the annual goal in each category and provides space for monthly data updates and explanations.
The manager level of leadership does not have an OA3 but instead utilizes a reporting tool called a gate chart (see sample). Each goal has a separate gate chart featuring a leading metric (the metric that aligns with the director OA3), a lagging metric, and specific tactics and timelines for impacting performance.
Reporting and communication
Following this goal-setting process and after populating the OA3 and gate charts, weekly report-outs begin each week focused on one of the four priority areas. Report-outs take place in a virtual meeting with managers reviewing the gate chart performance with front-line staff. This is followed by managers reporting their gate chart update to directors, who then provide a similar report to Physician and Operations Vice Presidents (VPs), and so on. Each of these report-outs follows the TAPE methodology, which stands for Target (what was the goal), Actual (what is the actual performance metric), and Please Explain (what were the actions or factors that contributed to that month’s performance).
Change management
The ODS process inherently supports change management surrounding efforts to meet annual goals by engaging the front-line staff and every level of physician and operational leadership in goal setting, action plan development, and performance tracking. A key component of successful implementation is training leaders and teams in the ODS process. Training sessions for all levels of leaders included a review of the principles of ODS, the OA3 and gate chart templates, and the TAPE reporting format, and included time for discussion and questions. Implementing operational goals, management for daily improvement and cascade reporting, and communication were key areas of discussion during these training sessions.
Stakeholder experience
To gauge the stakeholder experience, VPs and Director-level physician and operational leaders were surveyed about their experience with ODS. Among the 54 respondents, 61% agreed or strongly agreed that ODS has allowed them and their upline to focus on key areas for operational success. Moreover, 69% agreed or strongly agreed that ODS effectively aligns operational tactics with system strategy.
Lessons learned and next steps
The ODS at Corewell Health initially faced challenges as leaders at all levels adjusted to this new form of tracking and presenting metrics. As the process matured, these perceived notions morphed into support, engagement, and eagerness to introduce new ideas.
Survey results indicate that the leaders perceive improved focus in key operational areas due to ODS. The system has been adopted outside of service lines as well. Hospital medical staff leadership embraces value in aligned goals and now reports on the executive dashboard. Independent physicians are looking at ways to use ODS to improve their private practice structure and function.
Conclusion
Implementing ODS at Corewell Health has been thought-provoking, enlightening and rewarding. Previously top-down leadership in this space has moved to shared decision-making. As ODS progresses through year three, physician and operations leaders will build on lessons learned and broaden skills to make ODS an even richer process and a model for other organizations to follow.
Nowadays, with mounting pressure on businesses to be accountable for their environmental and social impact, it is no longer optional but expected for them to develop and implement sustainable business strategies that play out across three key areas: Environment, Social, and Governance (ESG). This pressure comes from rising public awareness, tightening regulations, and increased expectations from customers, employees, and investors.
Stakeholder engagement plays a significant role in the successful implementation of ESG strategies. In this article, let’s explore its functions and effects on ESG strategies.
The power of stakeholder engagement
Stakeholders are individuals, groups, or organizations that can influence or are affected by a company’s strategy from within and outside the organization. They can either drive change or resist it. Therefore, it is critical to identify stakeholders and understand their needs and expectations to ensure the ESG agenda reflects the priorities of those who matter and support the strategy’s long-term success.
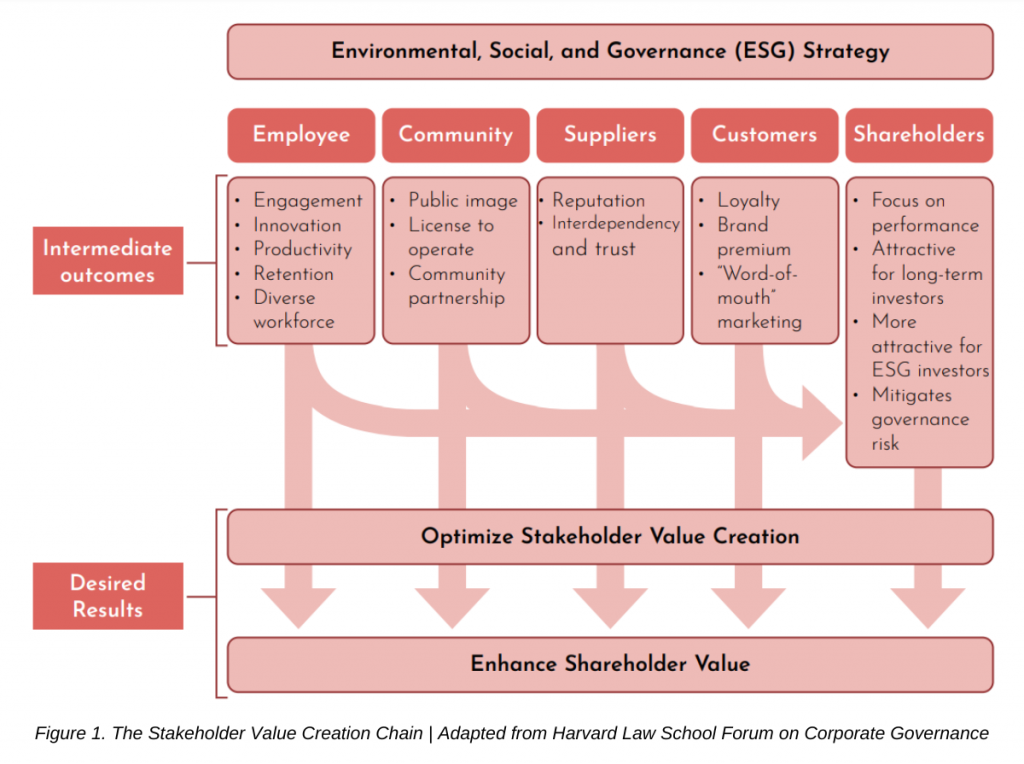
Pay Governance LLC, a firm that provides independent advice on executive compensation matters, has developed the Stakeholder Value Creation Chain model (See Figure 1) to better understand the effects of stakeholder engagement on the economic success of a business. It demonstrates how ESG strategy, the stakeholder model, and the generation of corporate value all intersect to provide various advantages for corporations.
Engaging with stakeholders during the strategy execution phase allows companies to foster collaboration, build trust and confidence, encourage support for ESG actions, evaluate how the actions are perceived, mitigate potential risks, and improve decision-making.
To know more about ESG strategy and how it exactly boosts stakeholder engagement based on a report, read the full article in the PERFORMANCE Magazine Issue No. 25 – Sustainability Edition. You can download a free digital copy through the TKI Marketplace. Printed copies are also available on Amazon. But the price may vary depending on location.
Image source: Nirutistock from Getty Images | Canva
“What you should see is an exponential improvement in the quality of service. You will have proactive service delivery. You will have the best quality output that will make you feel like the government understands you, that it feels you, that it serves tailor-made services for you specifically as an individual. That is the impact of AI in your life.” – The UAE Minister for Artificial Intelligence Omar Al Olama, viaEuronews.com
The COVID-19 pandemic has emphasized the discourse about the importance of digital transformation to the survival of an organization, especially in the public and government sector. At the World Government Summit 2022, it was evident that digital government has become a top priority as governments worldwide try to keep up with technological advancements and rapid change.
Digitalization provides more efficient and high-quality services and boosts communication between governments and citizens. The three most captivating qualities of a digital government are its capacity for effective service delivery, affordable scaling, and quick adaptation. Many large-scale digital innovations from telemedicine to telework, as well as from virtual courts to virtual education were implemented to aid the needs of the citizens and maintain government services. These initiatives show how relevant digitalization is now more than ever.
Despite the progress made by many governments, reaching a mature level of digitalization is not an easy endeavor. The development efforts of countries under unusual circumstances are still being hampered by persistent problems, especially in the least developed countries. For instance, in Africa, the price of mobile broadband connections remains extremely high relative to per capita gross national income making e-government developmental initiatives compromised.
From analog government to digital government
The digitization of government operations and public services—the switch from analog to electronic governance—has advanced dramatically during the past few decades. Governments have attempted to modernize their working practices through extensive public sector reforms to accommodate new technologies and citizen needs.
In the public sector, digital transformation plays a significant role in enhancing the potential of community participation, as well as process efficiency improvements in government organizations. Giving citizens a voice and the opportunity to participate in and work on governance increases public trust, and meeting evolving customer service needs remains a top priority.
Denmark recently introduced an e-participation initiative where individuals can suggest new legislation through the use of electronic petitions. The Danish parliament oversees the Borgerforslag (https://www.borgerforslag.dk/) initiative, which translates exactly to “citizen proposal.” As of now, this project already received a total of over 1400 proposals. The program is open to everybody who is eligible to vote in general elections in Denmark. They can propose, evaluate, and vote on proposals in the portal for the changes they believe the government or society should address. The proposal may be submitted as a motion for resolution if it is supported by 50,000 eligible voters in the general election.
In discussing digitalization in the government, e-government and digital government are two concepts that should be defined. Although these two ideas are commonly combined, they nevertheless refer to separate notions. E-government is described as the government’s use of Information and Communication Technologies (ICTs) to improve public services in the “E-Government Services Adoption: An Extension of the Unified Model of Electronic Government Adoption,” a study led by Isaac Kofi Mensah in 2020. Moreover, e-government deepens citizens’ connections to their government and promotes greater citizen involvement in the decision-making process. E-government aims to advance the effectiveness and transparency of the government by delivering services faster and cost-effectively and empowering citizens through participatory governance.
The idea of digital governance signifies a fundamental change in how governments globally are approaching their role. Governments are transforming how they use the power of information technologies: from establishing quantifiable administrative objectives to enhancing the provision of public services, from data-driven decision-making to implementing evidence-based regulations, and from providing more accountability and transparency within the government to boost public trust.
Furthermore, digital government services save employees’ time for bigger projects and reduce the production time and materials for the public services. According to GovOS, an organization that provides “innovative solutions and industry-leading services” to governments, digital government services, such as business license renewals, fishing license applications, and filing tax returns, do not require manual manpower to process an application. This allows the employee to focus on the more important projects.
Similarly, Secretary-General of the Asian Productivity Organization (APO) Dr. AKP Mochtan mentioned in the Digitalization of Public Service Delivery in Asia report that the delivery of public services can change from “being reactive to citizens’ needs to becoming proactive to anticipate future needs” as a result of the use of digital technologies.
Realizing the opportunities demands a paradigm shift in the use of digital technologies and data within governments, from e-government to digital government. In an effort to increase efficiency, an e-government approach sees technology as the answer for digitizing the delivery of an existing analog process. It puts emphasis on its implementation. In contrast, digital government practices place less emphasis on technology and more on re-engineering and revamping services and procedures to satisfy user needs. The establishment of digital-by-design cultures, which alter organizational behavior, goes hand in hand with this digitalization.
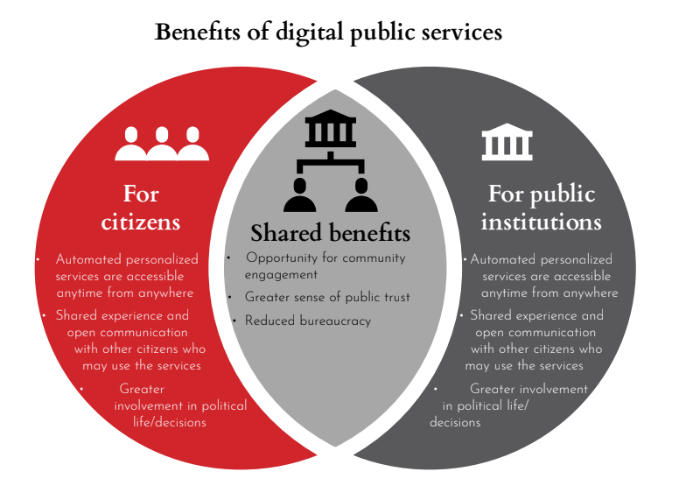
Benefits of digital public services
When properly implemented, e-government makes it possible for individuals, businesses, and organizations to connect with the government more conveniently, promptly, and affordably. The potential savings in expenses are also enormous. According to the European Commission, electronic billing in Denmark saves businesses and taxpayers a combined €200 million annually. Savings might reach $50 billion annually if implemented all over Europe. Meanwhile, e-procurement systems in Italy reduced expenses by nearly €3 billion.
E-Government results in increased internal productivity and efficiency of government workers, having more time for critical duties rather than more time-consuming tasks like filing reports or paperwork manually. It also boosts better cross-departmental collaboration since key documents are shared and can be easily found in a digital repository. Digital government services can lessen paper-based workflows that save governments money and benefit the environment. This will also result in decreased labor expenses.
Governments may accomplish more with fewer resources and provide greater services to their citizens using digital government services instead of sticking with conventional ones. These digital services for the government can also promote transparency and strengthen ties between the public and its governing body when any suspicion appears.
The conventional approach to service delivery entails several paper-based procedures, a minimal to no understanding of the business processes, a significant time and labor commitment, and no public access to the data collected. The advantages of digital government services not only assist in solving all of these challenges. But they also strengthen the bond between governments and their constituents.
Drivers and challenges
In times of social distance, the digital government has also played a crucial role in enabling public institutions to continue to be available and functional so they can meet citizens’ requirements. Only the governments in the region with the appropriate digital infrastructure have been able to provide services like transferring resources to people in need, distance learning for students, telemedicine, and the distribution of basic information on plans, strategies, and policies during the pandemic.
Governments increased their digital journey to meet their constituents’ needs by expanding digital infrastructure through automation and artificial intelligence, utilizing cloud-based services, and building a digital architecture for the entire government. Moreover, the government makes the public sector workforce more digital and invests in the interconnectedness of citizens to accelerate digitization during the pandemic.
In the coming years, a number of countries plan to considerably boost the amount they spend on digital infrastructure. The “digital divide” between the most and least connected communities will be addressed by investments in updating technology infrastructure and establishing fiber networks to boost internet access. As part of the Digital Spain 2025 initiative, the Spanish government plans to invest €20 billion in digital infrastructure in the next three years, with an additional €50 billion coming from private sources. The French government plans to invest €7 billion in digital projects, including modernizing public information systems and stepping up initiatives to include older individuals online.
In Thailand, 5G networks have facilitated cooperation between the public and private sectors and are a key part of the government’s Thailand 4.0 digital recovery plan. In a similar manner, the Scottish Government committed £4 million in financing as part of the Scotland 5G Connect Program for the construction of a number of hubs that would roll out 5G services throughout the nation. In addition, the Australian government invested over $21.2 million in commercial 5G trials and testbeds across important industry sectors to speed up the implementation.
Meanwhile, the United States has a reputation for being a leader in digital government services. Based on The KPI Institute’s Government Services Index (GSI) 2022, the United States is the top performer in the Digitalization dimension. The GSI 2022 report compiles and ranks 66 countries around seven regions in the world based on their performance in different dimensions and indicators. It highlights the Digitalization dimension, which refers to the significance of technology and redefining ways in how residents and public services interact.
The United States started its e-government journey two decades ago when the country published The E-Government Act of 2002. Its goal was to foster the utilization of the internet and new technologies across government agencies, as well as the provision of citizen-centric government information and services. The United States Digital Service (USDS), whose goal is to provide a better government experience, was also established.
This article was first published in the 24th printed edition of PERFORMANCE Magazine. You can get a free digital copy from the TKI Marketplace here or purchase a print copy from Amazon for a nominal fee here.
In the construction industry, the main product is the project undertaken for a specific client, the project owner. To award a project; the contractor has to study the project and submit his quotation. In most cases, the client selects the lowest bidder to execute the project.
Due to the nature of the contracting business, contracting companies cannot expect to award every project they have studied, and the winning ratio is most likely 20% to 30% from the overall tenders in which they have participated. That means contractors may lose more bids than awarded, which is quite alarming. Experts in this industry know this very well.
The main idea of writing this article is to introduce a new approach to contracting organization that can enable the contractors to increase the percentages of awarded projects and reduce the associated risks and cost impact, but before that, let us understand the current process and its drawbacks.
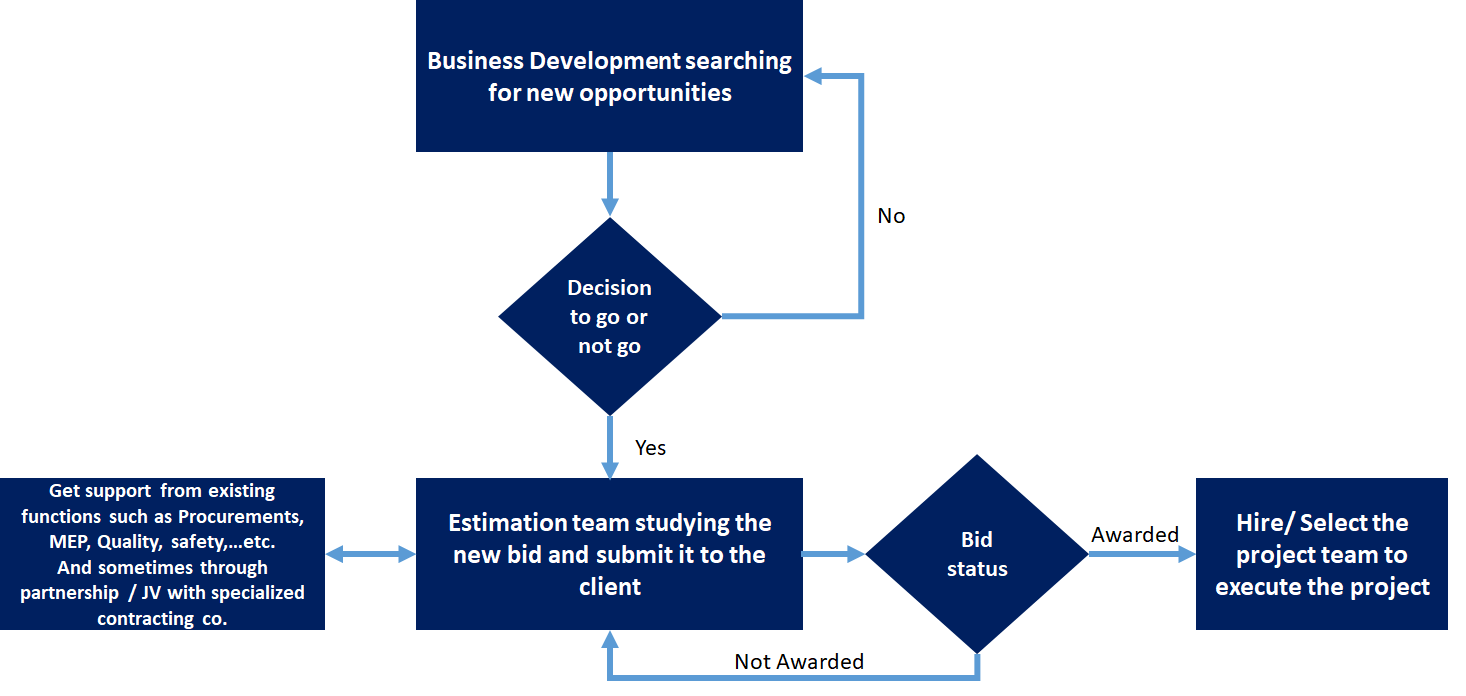
Most contracting companies use fixed estimation teams with some support from technical functions or outsourcing some services if needed, as shown in the conventional estimation process flow (Figure 1).
Figure 1. The conventional estimation process | Illustration by the author
This model seems to be ineffective for many reasons, including but not limited to the following:
A fixed estimation team may lack essential experience in a particular type of project.
Estimators’ work becomes routine without creativity. Whether they are awarded a new project or not, they will get paid every month.
Continual loss of projects by the same estimators will demotivate them and eventually lead to losing their passion. Instead, they will try to find excuses or justifications rather than improve the process.
Awarding a project doesn’t mean that it will be profitable. Contractors can award a project because they are the lowest bidder; however, hidden losses will emerge during the project’s progress.
A misalignment between the bidding prices and the project budget prepared by the cost control team can lead to a significant loss even before the project starts.
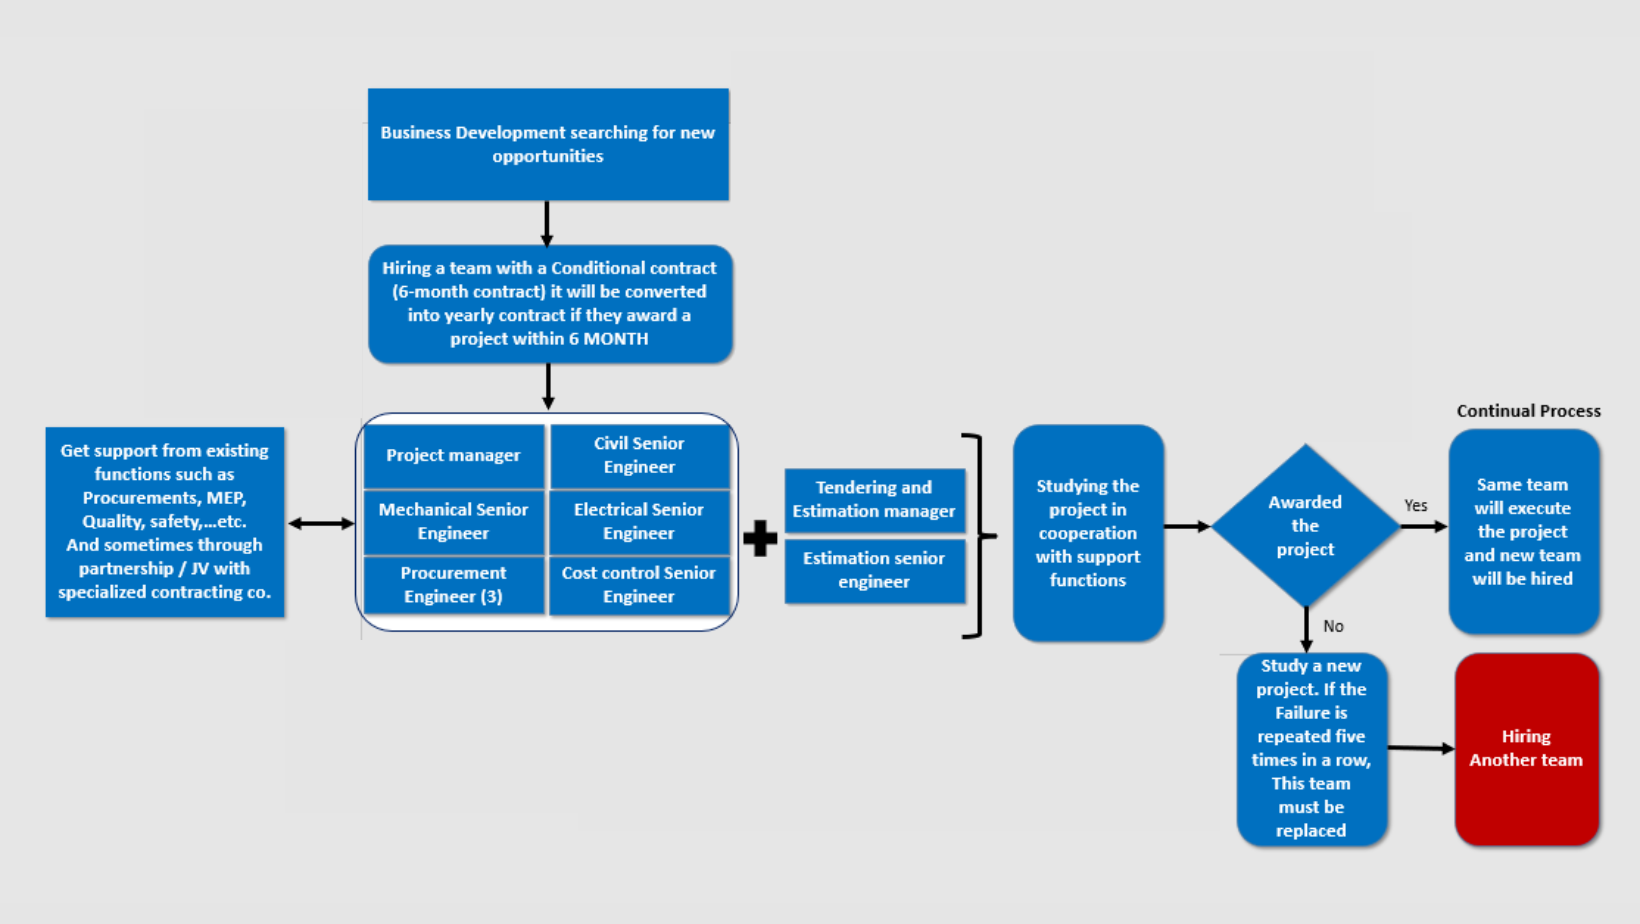
The main objectives of the new approach are to make the estimation process more dynamic, profitable, and efficient. To achieve these objectives, I have developed a new process flow for the estimation process (Figure 2) to enable the company to increase its chances of awarding projects.
Figure 2: a new estimation process | Illustration by the author
Steps of the new process
The company should reduce the number of fixed estimators to the lowest possible level.
After identifying the new opportunities, the company will know more details about the project type and engineering characteristics of the project. Based on that, the company will hire a qualified project manager with previous experience in similar projects. It is the same thing for senior engineers in civil, electrical, and mechanical disciplines and professional procurement engineers who are familiar with the type of construction material used in that project.
If necessary, this team will study the project in conjunction with the estimation team, other support functions, and the partner company.
If the company awarded the project, this would prove the idea from the first round. If not, the company will give the team a chance to learn from this failure and enhance their experience to perform better in the next bid.
If the project is awarded, the same team who studied the project and calculated its budget will be mobilized to execute the project, and the company will hire a new team instead, and so on.
The company has to decide on a certain number of trials for this team and then make a decision to replace them if the failure is repeated. I would suggest five trials within six months according to a conditional contract.
The advantages of the new estimation process
It is more dynamic than the old routine process.
The team who studied the project and calculated the budget is the same team who will execute the project.
Encouraging the project team to put their best effort into awarding a project within a six-month timeframe.
When the winning ratio is increased, it will save huge costs if we compare the (overhead cost of the new approach vs. sales) with the (overhead cost of the old process vs. sales).
Increasing profitability by increasing the number of awarded projects
Increasing efficiency and productivity through better use of company resources and workforce
The challenges of the new process
How fast the company hires a competent project team every six months could be an issue, and it requires a professional recruitment team to achieve this successfully.
Not everyone can accept the six-month conditional contract, but professional recruiters who are excellent negotiators can clearly explain the benefits to the candidates. It is a win-win agreement. This exercise will spot incompetent people before recruiting them, but the confident project managers and engineers will accept the challenge because they know they can.
Change resistance to shift from the old process to the new process. Some people know they are losing but still believe the old process is the best way to award projects.
Undoubtedly, getting an accurate estimate from experienced engineers is invaluable to the company; this is why the team you choose to study your bids should be able to furnish an accurate cost estimate that is precise enough to increase your opportunities of awarding projects. The new process helps the company to enhance the accountability of the project team with clear ownership of the project execution within budget, scope, and specification with full understanding and involvement from day one. The new process can be tested in a pilot project to ensure its effectiveness and then implemented on a large scale.
About the author
Mr. Ihab Ibrahim Alsakkti is the chief strategy officer of Alkifah Holding Company. He is consistently focused on the organization’s future direction and aligns his team to actualize that vision. He established the company’s Innovation lab, which serves as the hub employing the methods of agile management and innovation strategy to devise novel ideas that can either disrupt or complement the overall company. He supported senior management with strategy formulation and execution workshops and the development of short-term and long-term strategic plans. He also coached and mentored junior staff through ongoing extensive self-development sessions and training programs, specifically in project management for new initiatives, performance management, KPI selection, balancing, and activation.
Robot restaurants in technologically advanced countries like Japan and USA are considered solutions to labor shortages and growing customer demand as on-premise dining starts to pick up.Yelp Economic Average reports that searches for reservations increased by 107% in the first quarter of 2022 compared to the same period in 2021.
Digitalization has become the key to service improvements in restaurants, and one of these advancements is robotics. Different processes can be automated by using robots. While such automation can impact the performance of a restaurant, applying robotics also comes with challenges.
Improvements
Approximately 82% of restaurant jobs could be replaced by robots in the future, according to a report published by Aaron Allen & Associates. Robots are used to help humans in the kitchen perform repetitive tasks, such as slicing or mixing ingredients. Robots can also:
welcome guests
take and deliver orders
manage payments
According to articles from ResearchGate, the Turkish Business Journal, and Elsevier, robotics decreases the efforts of individual waiters, reducesinvestments in human labor, simplifies food orders, supports restaurant services, decreases human-induced service failures, reduces work hours, and improves service quality.
Hospitality & Catering News states that an average human server can serve 200 meals daily, while a robot server can serve 300-400 meals. If waiters serve more tables in the same period, they can serve the dishes faster, contributing to an increase in the restaurant’s overall productivity.
Recent research on digital responses to COVID-19 highlights that if the waiting times per table increase, the time spent at a table increases. This means that the table will be occupied for a long time, negatively affecting customer satisfaction and total revenues for the restaurant since they have a limited number of tables. The waiting time per table can be decreased by implementing electronic menus so that the cooks do not have to read the order notes from waiters. This is a process that slows them down and increases the risk of mixing up orders.
An IEEE article explains how robots and electronic menus cut down on wait times per table. When a customer orders something using an electronic menu, the order and the table number appear on the cook’s screen. When the chef has finished cooking, the order is transferred to the robot, which will have the table number of that specific order so it can deliver it to the customer. Digital tools help visualize orders and provide systematic overviews.
As stated in a 2020 Atlantis Press article, digital tools simplify the process of choosing the desired dishes. These digital platforms also enable keeping statistics of ordered dishes so that the restaurant can determine what foods are most popular and when (during particular times of the day or seasons), as well as which foods to leave off their menu. Additionally, by offering discounts in their ordering application, restaurants will increase customer loyalty.
Challenges
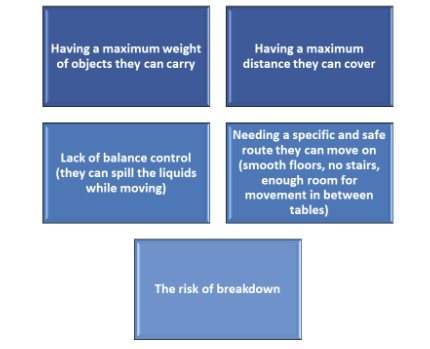
There are two types of challenges that emerge from using robots in restaurants. The first kind results from the complexity and technical limitations of the machine (see Figure 1):
Consumer acceptance is another challenge for digitalizing restaurant services. Studies have revealed that some people feel uncomfortable interacting with a robot. Before bringing autonomous robots into restaurants, owners should assess socioeconomic implications, such as the balance between operational efficiency and customer expectations and robot costs.
Process automation will increase productivity in the restaurant industry, but this will also make it difficult for restaurant workers to find new employment.
Digitalization of the restaurant business is inevitable. Initially, the new system may cause chaos because every restaurant owner will be eager to implement such technologies. This enthusiasm can result in impulsive investments to keep up with the competition, leading to unnecessary risks and, ultimately, no added value for that business. But, if safely adopted, robotics may improve performance, increase productivity, and decrease overall costs. Even though the goal may be to digitalize the whole restaurant, these robots will only partially operate by themselves so soon.