Imagine a manufacturing plant aiming to maintain operational excellence while facing potential safety hazards every day. In such a scenario, tracking key performance indicators (KPIs) such as production efficiency and output is needed for assessing performance. However, without considering key risk indicators (KRIs) like workplace incidents or equipment failure rates, the plant may overlook critical safety concerns until they become costly disruptions or accidents.
Integrating KPIs and KRIs enables the plant to proactively manage both performance and risk and ensure smooth operations while prioritizing employee safety. Overall, this integration is essential for promoting ongoing improvement and awareness of risks within the organization.
The KPI Institute defines KPI as a measurable expression for the achievement of a desired level of results in an area relevant to the evaluated entity’s activity. KRI is a measure used to evaluate the likelihood of an event’s probability and consequences that could exceed the organization’s risk appetite and significantly harm the success of the organization.
While most organizations rely heavily on KPIs, rooted in historical data, these may offer limited insight into future threats. KRIs modify the narrative by beginning with a proactive framework for risk management and developing measurements around prospective pitfalls in the future.
Improving risk management
Utilizing both KPIs and KRIs would provide a more systematic approach to risk management compared to relying solely on KPIs. For instance, within the supply chain context, KRIs may cover aspects, such as supplier performance, reporting accuracy, and emerging industry trends. This gives the organization a clear picture of all possible hazards and enables it to foresee and handle issues before they have an adverse effect on operations. Here are the overarching benefits of using KRIs in risk management:
Proactive identification: With KRIs, organizations can proactively detect potential risks before they occur. For example, by monitoring supplier performance to anticipate supply chain disruptions or analyzing industry trends to predict market shifts, organizations can minimize possible harm. This proactive approach enables early intervention and allows the organization to implement preventive measures.
Root cause analysis: KRIs encourage delving deeper than immediate events to identify the underlying root causes behind potential risks. For example, rather than simply reacting to a decrease in supplier performance, KRIs can signal organizations to uncover the reasons behind it, whether due to internal issues, external market forces, or other factors. By addressing root causes, organizations can develop more effective risk management strategies and prevent similar issues from recurring in the future.
Decisions based on data: Integrating risk assessment into current data streams allows organizations to make informed decisions in real-time. By leveraging KRIs and building alerts or other KRI-based solutions, organizations can access timely and pertinent information to guide decision-making processes. For instance, by monitoring relevant data points, such as financial indicators, organizations can quickly identify emerging risks and take appropriate actions to manage them. This allows organizations to be resilient and agile in the face of uncertainty.
Implementing KRIs
Organizations must understand the relationship between risk and performance to improve cross-functional collaboration and incorporate risk concerns into business decisions. For the integration to be successful, KRIs should be reported and communicated effectively. To create KRIs and corresponding mitigation plans, the individual who oversees the Enterprise Risk Management (ERM) process should work with the risk owners. The “risk owners,” who can effectively oversee their business units in line with their individual units’ risk goals, are the main benefactors of KRIs.
Risk owners must evaluate KRI data pertaining to risks that impact their units on a frequent basis. It is important to acknowledge that the different methods for reviewing KRI data also depend on an organization’s functions. In addition, successful identification and implementation of KRIs also requires a structured approach with the following key steps: identifying key metrics, assessing gaps, improving metrics, validating and setting trigger levels, and establishing a risk control plan.
Harnessing the power of KRIs alongside KPIs emphasizes the link between successful risk management and successful organization outcomes. This encourages a proactive attitude to risk, in which mitigating risk is viewed as an investment in accomplishing corporate objectives rather than as a cost.
Nawaf Al Omari boasts over a decade of experience in optimizing teams and driving project management success. He excels at forecasting staffing needs, resource management, and fostering collaborations, with a 40% increase in stakeholder satisfaction. Prioritizing data-driven decision-making, he is adept at mitigating risks, tracking KPIs, and achieving cost reductions. Nawaf is strongly committed to delivering results and operational excellence.
The popularity of sustainability has surged in recent years, causing organizations to grapple with balancing short-term profits with long-term sustainable practices. This has led to concepts like shared value and corporate social responsibility, with companies aiming to create economic and social value while reducing their environmental impact. The movement has sparked active efforts, with social innovators, policymakers, investors, and academics all striving to measure sustainability.
In today’s world, companies must move beyond outdated economic metrics and adopt KPIs that consider the triple bottom line, including social, economic, and environmental aspects of their operations, all while promoting sustainable human well-being.
However, sustainability is a constantly evolving concept that adapts to context and cannot be measured with a single yardstick. The balance between social, economic, and environmental considerations is crucial to achieving sustainability. It is like walking on a tightrope, requiring constant adjustments to maintain equilibrium in a changing world. Each context requires a unique approach, with varying weights and measures for different factors. Customized solutions are needed that address stakeholder needs while maintaining long-term balance, as a one-size-fits-all formula won’t work.
About the Expert
• As a Managing Director, Teodora leads development initiatives to support and enhance the organization’s strategic plan and manages the development and growth of the MENA branch of The KPI Institute.
• An expert researcher, consultant and practitioner with six years of experience in the deployment and implementation of KPI Management Frameworks.
• Pursuing a PhD. in Management on the topic: Rethinking the Performance Management Systems to ensure organizational sustainability, Lucian Blaga University, Romania
• Postgraduate Program in Entrepreneurship and Venture Creation, ISCTE Business School Lisbon, Portugal
• Master’s Degree in Project Management, Romanian-German University, Romania
Image source: grapestock from Getty Images | Canva
In modern business, focusing on customer experience (CX) is no longer a nice-to-have, but rather a necessity for businesses of all sizes. However, defining a successful customer experience can be difficult because many touch points form the customer journey. By using online surveys, companies can gain quantitative information about the customer experience to actively monitor trends that develop over time. Based on customer feedback, organizations can identify areas for improvement, adjust their strategies accordingly, set better goals for their key performance indicators (KPIs), and strive to deliver the seamless experiences that today’s consumers expect.
Customer experience KPIs
Research shows that CX is now competing with traditional factors such as price and quality in influencing customer loyalty and advocacy. According to Forbes, 77% of consumers consider CX just as important as the main product or service itself. PWC reported that even beloved brands risk losing 32% of their customers after one negative interaction. In addition, poor CX burdens the company with costs. To address this, this article outlines five critical CX KPIs that can be systematically monitored, evaluated, and optimized to help address customer service problems and strengthen a company’s connections with its customer base.
1. % Customer satisfaction score (CSAT)
This KPI measures how customers rate particular interactions with a company, such as getting a response from customer care or processing a return. Users can score their satisfaction with the experience on a scale from “very dissatisfied” to “very satisfied” by responding to an automated questionnaire sent to them. Monitoring the ratings depends on a company’s objectives, but the general rule is that anything above 85% is excellent, and anything below 60% requires rapid attention.
Calculation: CSAT = (Number of Positive Responses / Total Number of Responses) x 100
2. # Net promoter score (NPS)
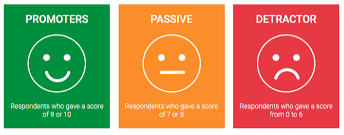
The NPS, considered the most famous CX KPI, reflects the willingness of consumers to recommend a product to friends and acquaintances. To calculate NPS, a company can conduct a survey of customers from one query: “What is the probability that you will recommend the product to your friends?” The answer is given on a 10-point scale, where 0 is “I will not recommend it in any case” and 10 is “I will definitely recommend.” The respondents can be divided into three groups depending on the scores obtained: promoters, passives, and detractors. The majority of companies consider a score above 80 as excellent, a score between 50 and 80 as very good, and a score below 50 as good.
Calculation: NPS = % Promoters – % Detractors.
3. % Word of Mouth Index (WoMI)
An extension of the NPS index, the creation of the WoMI was motivated by criticism towards the traditional NPS. Researchers believed that the NPS made the incorrect assumption that if a customer does not recommend a product or service, then they are automatically considered detractors. This led researchers to make adjustments to the KPI in order to better reflect reality. It tracks the recommendation, but from the opposite perspective: “What is the probability that you will discourage people from doing business with the company?” This can be rated on a scale of 0 to 10. Those who choose 9-10 on the scale of “dissuading” are categorized as “true detractors.” The threshold varies from one industry to another. It is better to have a lower score, as the target for most companies is less than 10%. To gain a comprehensive understanding of your company’s position among customers, we suggest employing both approaches to obtain a complete picture.
WoMI = (Number of Promoters – Number of Detractors) / Number of Respondents * 100.
4. Consumer Effort Score (CES)
The CES index, which was developed in 2010, is related to the idea that the more effort the product or service requires from customers, the less likely they are to stay with the company. As cited in an article, research by the Corporate Executive Board (CEB) shows that 94% of customers who have an effortless experience are likely to make repeat purchases. The KPI could be measured by the customer’s response to a statement like: “Thanks to the service/product of company X. I was able to easily cope with my problem.” with a rating scale of 1 to 7. Most companies typically receive CES scores ranging from 5 to 5.5. A score exceeding 6 is generally considered above average.
CES = (Sum of response scores) ÷ (Number of responses)
5. Customer churn rate
Simply put, the churn rate is the number of users who stop any interaction with the company. Depending on the industry, this could mean that customers deleted their account, did not re-buy, or simply decided to switch to a competitor. In its simplest form, customer churn can be calculated by comparing the number of customers lost to the total number of customers. By dividing one metric by another, one can get the customer churn rate as a percentage of the total base. The most common acceptable churn rate is 5-7% annually.
Enabling effective CX measurement
KPIs must be monitored and measured in order to improve CX. To do so effectively, a system that accurately collects data from all channels should be considered. This allows requests to be categorized and common issues to be identified. In-depth interviews with both loyal and dissatisfied customers should be conducted to understand the root cause of any problems, as some of which could be related to support services. Consistency in tracking and improving CX KPIs is the key to ensuring decisions and actions in customer service adapt to changing customer sentiment and meeting their needs.
Take your CX to the next level! Visit smartKPIs.com for a comprehensive, 360-degree view of CX KPIs.
Corporate sustainability (CS) represents a business approach that creates long-term shareholder value by embracing opportunities and managing risks derived from economic, environmental, and social developments, Yale University states. Organizations are increasingly realizing that their long-term success and profitability depend on measuring the financial impact of CS initiatives for several reasons: enhanced risk management, increased cost efficiency, greater investor demand, and improved brand reputation—ideas that were highlighted in a 2022 paper from the International Journal of Economics and Management.
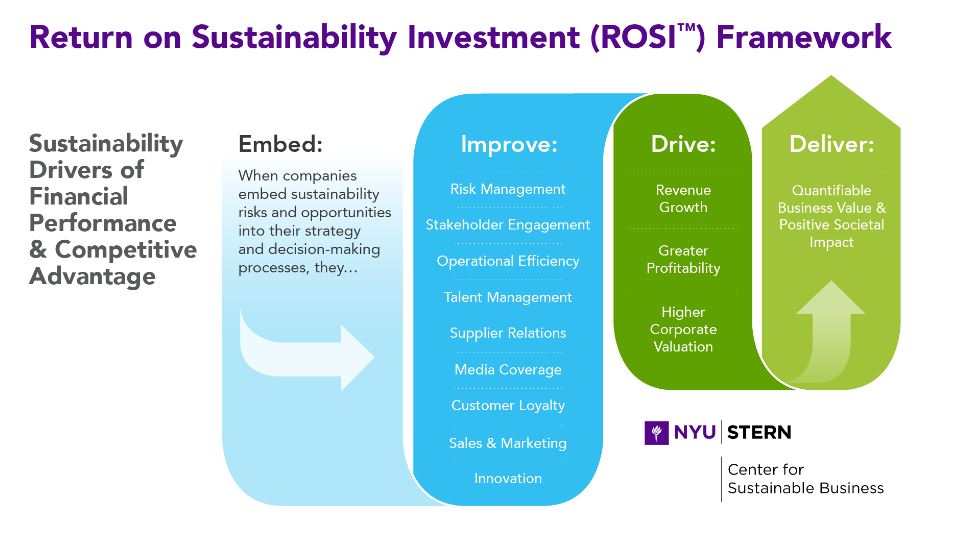
The NYU Stern Center for Sustainable Business developed the Return on Sustainable Investment (ROSI™) framework as a methodology used to evaluate the financial performance and returns generated from sustainability initiatives. It aims to measure the economic benefits derived from sustainability investments and assess the value created for the organization.
ROSI™ assists decision-making processes, resource allocation, and the prioritization of sustainability investments based on their potential financial returns. The framework also facilitates communication with stakeholders (i.e. investors, customers, and employees) by quantifying the financial value created through sustainable practices. The sustainability drivers of financial performance and competitive advantage based on ROSI™ methodology can be consulted below (see Figure 1).
Entities need to follow a clear set of steps to implement the ROSI™ methodology, per The NYU Stern Center for Sustainable Business:
Identify material sustainability practices.
Determine the potential benefits that might drive financial and societal value from sustainability-focused practices.
Quantify benefits derived from the sustainability practices.
Derive a monetary value for the benefits.
The main advantage that ROSI™ brings is helping companies make a compelling business case for sustainability, driving both financial value and positive societal impact while advancing sustainability goals, as NYU Stern concludes in a report published in 2021.
HSBC Bank USA and the NYU Stern Center have launched the Food and Agriculture Sustainability Strategies Framework, based on ROSI™ to help food and agriculture companies make a business case for sustainable initiatives that deliver financial value and societal impact. The framework identifies twelve sustainable strategies and describes practical suggestions for calculating returns. It serves as a strategic tool for unlocking the advantages of sustainability and driving real change in the industry.
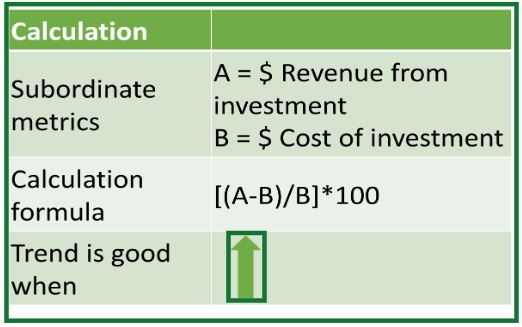
According to Forbes—and adapted to adhere to The KPI Institute’s KPI naming standards—% Return on investment (% ROI) is a KPI that measures the efficiency or profitability of an investment or compares the efficiency of several different investments. This metric is also used to measure and evaluate the financial impact of organizational sustainability initiatives, making it easier to understand the value proposition of certain environmental, social, and governance (ESG) criteria used in socially responsible investing. A positive % ROI score indicates a profitable outcome, as the gains generated from the investment exceed the costs incurred (see Figure 2).
An article from Brightest presented findings based on data gathered between 2020 – 2023 from five top companies that measure the ROI of sustainability. It stated that companies like HP Inc. ($3.5B), Unilever ($1.2B), McKesson ($227M), Nike ($50M), Anheuser-Busch ($7.5M), and Medtronic ($2.2M) earned extensive profit from internal cost savings actions based on sustainability criteria like energy efficiency or waste reducing. By demonstrating the financial value of sustainable practices, % ROI enhances the business case for social investment and encourages stronger ESG administration, balancing monetary performance with social and environmental impact.
ROSI™ and % ROI are valuable tools for measuring the financial impact of sustainability initiatives. ROSI™ goes beyond traditional metrics, helping companies understand the value of sustainability strategies. Meanwhile, % ROI quantifies the fiscal returns generated, enabling data-driven decision-making. Together, they support making informed choices, practicing accountability, and leaving behind a positive environmental and societal impact while delivering long-term financial value.
The global economy felt the effects of the COVID-19 outbreak, and the IT sector was no exception. Because of the economic slump, various IT companies have announced layoffs. Since the beginning of 2023, the IT industry layoffs wave topped the media with a 649% spike in cases reported last year. When workforce reductions take place, the strength of an organization’s employer brand may suffer significantly.
Taking the layoffs at Twitter as an example, only 2% of the remaining employees suggest the company as a good place to work, and 1% believe that the company treated the affected employees with dignity. Understanding the consequences of layoffs on a company’s reputation will enable management to analyze perception trends and develop long-term solutions. One approach is to use key performance indicators (KPIs) such as # Employee Net Promoter Score (eNPS) or # Employment brand strength.
Employment brand strength
# Employment brand strength is an important KPI for any organization that wants to recruit and retain top talent and foster an engaging workplace while maintaining business viability. Employment brand strength is a metric that measures how prospective and current employees view a company.
Tracking # Employment brand strength can help companies monitor their progress over time and identify areas of improvement in different aspects such as brand awareness, work-life balance, career development opportunities, and social responsibility. This will result in a more positive work environment, the attraction of more top talent, and the achievement of their business objectives.
eNPS
Employee net promoter score is a KPI that companies use to measure employee loyalty and satisfaction. Similarly to the NPS for consumers, eNPS applies the same principle to workers, measuring how likely they are to recommend their company as a place to work. Because it is straightforward and easy to track. It can also assist businesses in assessing their employee experience and evaluating their objectives. eNPS can also be used to compare the performance of a company to that of its competitors.
Figure 1. eNPS | Source: Questpro
eNPS is a valuable KPI that can assist firms in measuring and improving employee happiness and loyalty, leading to increased productivity, fewer attrition, and improved business results.
How to measure it
Employee surveys can be utilized to assess employee satisfaction, engagement, and retention. eNPS is the most dependable and widely used employee survey method. It simply asks, “On a scale from 0 to 10, how likely are you to recommend your workplace?” Negative aggregate eNPS scores (Promoters – Detractors) are a major warning sign.
Candidate surveys can be used to identify areas in which the employer brand appeals to potential candidates.
Social media monitoring can be used to observe online conversations.
Communication is the key
According to Forbes, the company should exhibit compassion for the process. Employees will have numerous questions, and managers must address their concerns, so it is important to implement an open-door policy. Providing job search assistance may also help companies reduce the likelihood of negative comments. Companies should also monitor and anticipate such remarks on social media platforms like Glassdoor and prepare diplomatic responses.
However, it is preferable to forestall it from the beginning.
After Nokia’s 2008 earnings rose 67%, the CEO let off 2,000 or more employees to save expenses, which harmed the employer brand and triggered demonstrations.Three years later, in 2011, Nokia had to go through another layoff wave, but at this point they reformed and included the impacted staff to guarantee a seamless transition and avoid negative feedback.
By handling layoffs with transparency, fairness, and compassion, focusing on employee retention and engagement, and tracking the reputation of the employer brand properly, companies can mitigate the damage and maintain a positive work environment amid the tech industry crisis.