Personal performance and data visualization. A love story?

When we think about the world we live in today, one of the first words to come to our minds is “data”. Huge, overwhelming amounts of data, both in our personal and professional lives. As people as increasingly applying the “visual is better” principle when trying to communicate information in the most effective way, there seems to be a real love story between personal performance and data visualization nowadays.
On social media channels we have timelines, which arrange our life events on a visually attractive scale. Mobile apps create graphs to illustrate our physical activity, sleeping patterns and even our mood. Data visualization seems to take over the way we look at our lives.
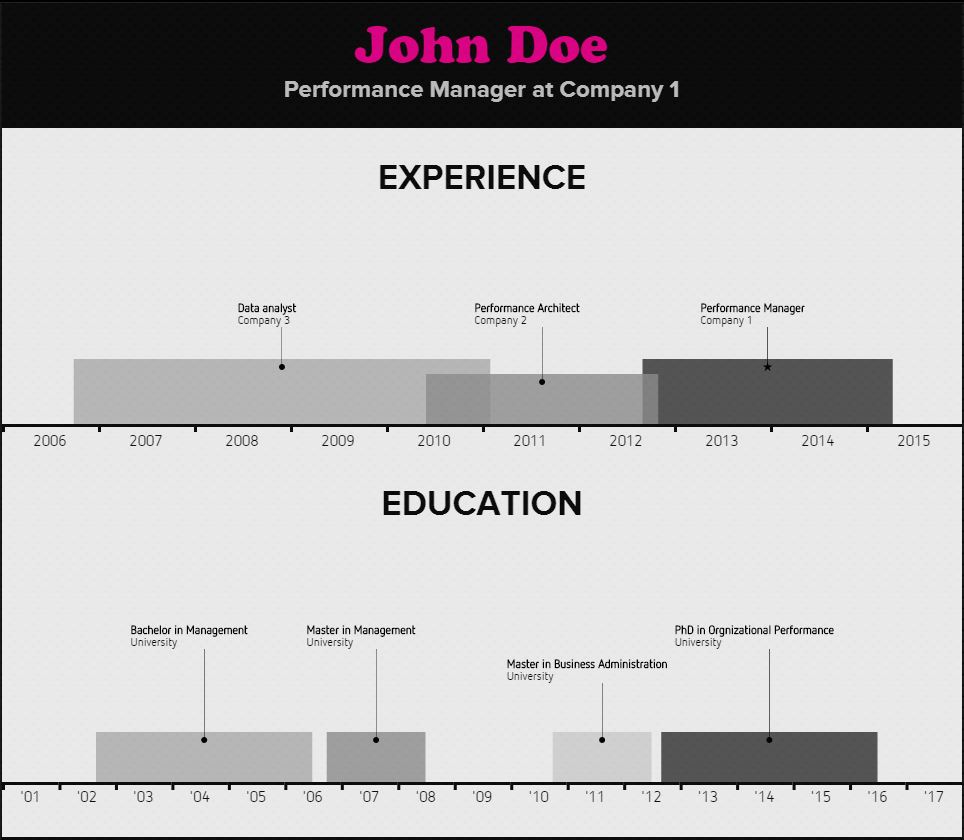
One element that has lately gained a lot of popularity is the visual resume. If the simple notion of resume or CV is no longer a secret for any professional, the concept of visual resume changes many aspects we knew up until now.
An enabler, from this point of view, is visualize.me, a website which assists people in expressing their accomplishments in a simple, yet compelling way. Their vision is to help people turn their education, skills and experience into opportunities, and they do so by turning your resume into a web-based infographic.
How does it work?
It is all just one click away. After creating an account by simply introducing your email and a nickname, all the needed information will be gathered from the LinkedIn account associated to the provided email address. Data is gathered and organized automatically, so neither analysis nor graphic design skills are requires.
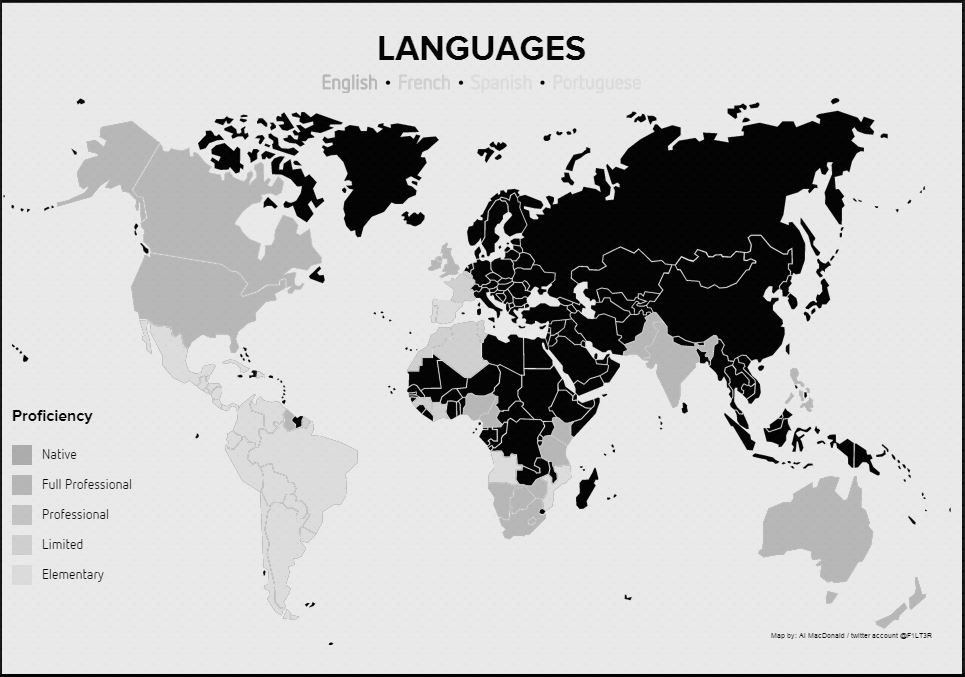
Categories such as Profile Summary, Work Experience, Education, Links, Skills, Interests, Languages, Awards & Honors, as well as Recommendations are imported from your LinkedIn account. After importing your information, you can change it and adapt according to your purpose. More specifically, you can choose the categories that will appear in the resume, arrange your top 10 Recommendations, rank your Awards according to their importance and so on.
The design is very easily customizable and the options are extended. Six main themes are available, which can be furtherly customized by choosing from a wide variety of colors. Moreover, background images can be uploaded.
When it comes to the sharing possibilities, the finalized resume can be referred to by simply using the link provided, by embedding an icon on your website or by adding it to your social media profiles. It can also be saved as an image, which will enable future printing. Another important function is the generation of graphs including your profile views in the past 7 days and in the last month, the top industries viewing your page, as well as the top referrals.
Another example of such an enabler is Venngage, a platform that allows you to build infographics either from scratch or by using pre-established templates. For a Premium subscription, you can choose to customize your own Resume infographic, by using one of the 9 templates.
In the urge to stand out and to gain a personal and professional competitive edge, people have started using numerous tools, and the classic resume makes no exception. Infographic-like resumes seem to have become a trend lately, as they are attractive, easy to follow and, very important, easy to generate.
It looks like visualization tools are slowly but surely catching up with the large amounts of data, and we might soon face some another challenge: how much visualization is actually too much? As long as you maintain a balance between quantitative and qualitative information regarding your experience and accomplishments, while keeping your visualizations concise, simple and professional, you should have nothing but great advantages from using these tools.
References:
Image Sources:

Tags: Data Visualization, Personal performance