Is data visualization a science or a language?
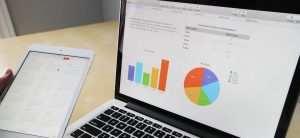
Image Source: StockSnap | Pixabay
Is data visualization a science or a language?/
That is a question posed by Colin Ware in his book, “Information Visualization.”
We deal with data every day, especially at work. It can fuel our decisions and change the way we work. At the same time, if we’re surrounded by a huge amount of data, we may not find it easy to arrive at an optimal decision. This is where data visualization comes in.
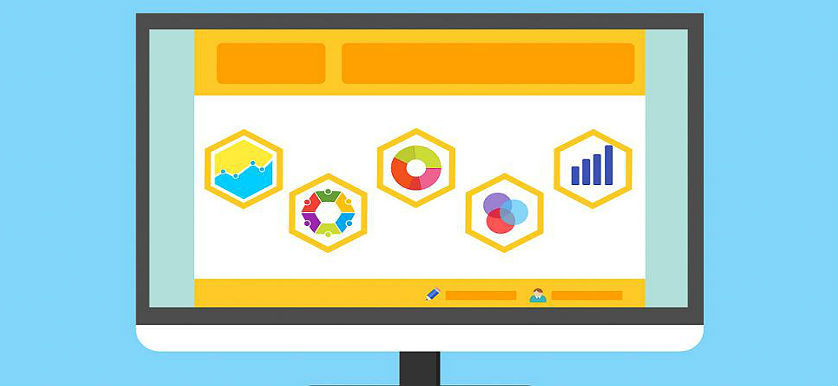
Data visualization refers to the graphical representation of the data. It makes large amounts of information easier to understand and helps identify patterns and trends. People can easily comprehend information and make conclusions through data visualization.
“Graphical excellence is that which gives to the viewer the greatest number of ideas in the shortest time with the least ink in the smallest space,” wrote American statistician Edward R. Tuffe, author of the book “The Visual Display of Quantitative Information.”
Understanding how to approach data visualization allows people to equip themselves with the right tools, approach, and strategies as they gather data and present them visually. This is important to businesses who want to understand consumer behavior patterns or governments seeking data-backed insights on a crisis.
Data visualization may be considered a science because it is a process and represents data methodically and accurately. Data visualization begins with volumes of information, undergoes an intensive cleaning, classification, statistical and mathematical modeling, analysis, and design process, and ends with a visualization.
On the other hand, many argue that data visualization is a language because it uses diagrams to convey meaning. Data is encoded into symbology and semiology. The syntax and conventions of these diagrams are not inherent and must be learned.
Data visualization helps to communicate analytics results in pictures. In simple words, data visualization is the language of images. That is on par with the language of words both written and spoken and with the language of numbers and statistics.
Merging science and language
Science and language do not have to invalidate each other. Their elements can go hand in hand in data visualization.
In data visualization, the challenge is how to make more people take interest in scientifically processed data. Presenting appropriate and relevant information in an engaging format through design is what makes data visualization successful. Science processes and provides information based on certain objectives while design is a form of communication shaped by visual elements.
Combined, scientific data and design can generate meaning out of raw data. The end result of data visualization is almost always a story. In storytelling, the plot (design) won’t be able to progress without the characters (scientific data) and vice versa.
Ensuring that graphs and charts present meaningful results is important now more than ever. In MicroStrategy’s “2018 Global State of Enterprise Analytics,” 63% of data-driven organizations said that implementing analytics initiatives led to high efficiency and productivity while 57% said they became more effective in decision making.
With this, the challenge for organizations is to know how to structure, format, and present their graphical data that will allow them to make faster business decisions. Sign up for The KPI Institute’s Certified Data Visualization Professional course to learn the fundamentals of creating visual representations, the most effective layouts, channel selection, and reporting best practices.