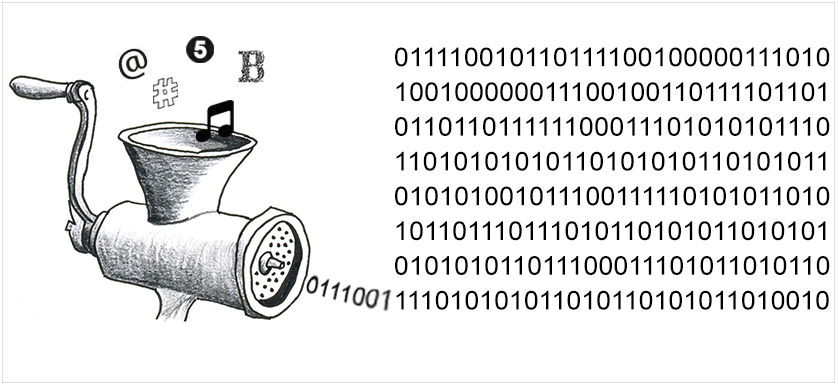
Crafting a visualization is more than simply translating a table of information into a visual display. Data visualization ought to communicate information in the most effective way, with the prime purpose of truly revealing data in a quick, accurate, powerful and long-lasting manner. Representative visuals can easily summarize and communicate data to other people, making even the largest or most complicated sets of data understandable.
Discussions on data visualization have rapidly increased over the last years as more executives, managers, analysts and basically everybody, wish for a better understanding of the raw data behind every day dashboards, scorecards or presidential poll results. The struggle is to bring the raw data to life in a simple and comprehensible manner.
In the words of the data visualization expert Edward Tufte, “Graphical excellence is that which gives to the viewer the greatest number of ideas in the shortest time, with the least ink, in the smallest space.”
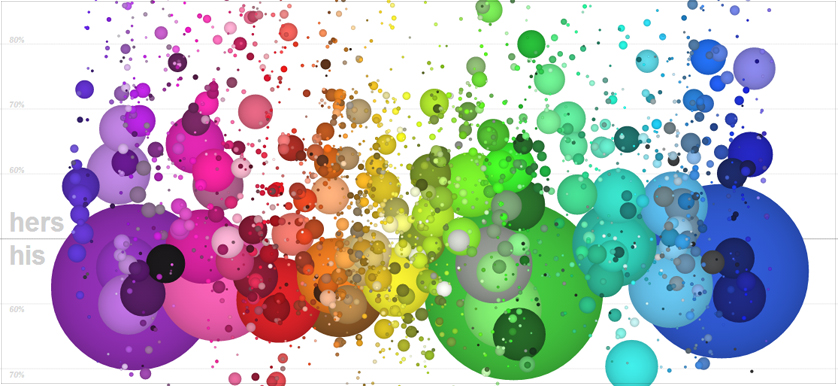
Data visualization is, roughly, the visual representation of information. From business executives and managers to business analysts or operations/manufacturing/supply chain managers, they all use charts, tables, histograms of other types of graphics to better visualize their data. Bar charts, line charts, scatter graphs and maps are simple examples of data visualization that have been used for decades.
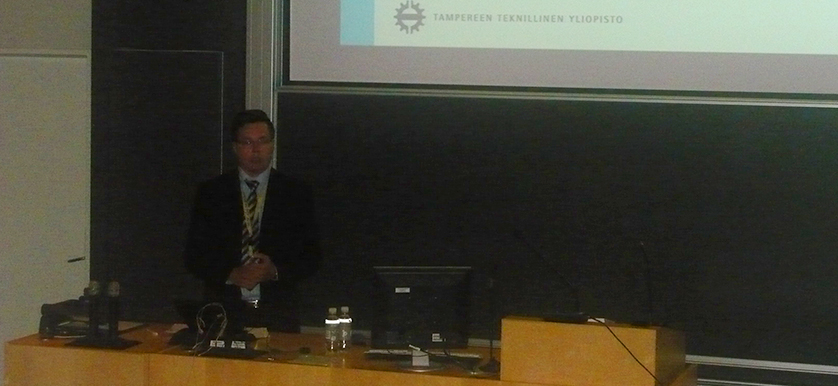
On the second day of the PMA 2014 Conference, Dr. Aki Jääskeläinen, postdoctoral researcher and M.Sc. Juho-Matias Roitto, project researcher at Tampere University of Technology, Finland delivered a presentation named “Analysis of visualization techniques supporting performance measurement process”.