The 2015 trends in software solutions. Magic Quadrant for Business Intelligence and Analytics Platforms

Each February, Gartner releases one of its most important research reports: the Magic Quadrant for Business Intelligence. Two years ago, the name of this Magic Quadrant was changed, from “Business Intelligence Platforms” to “Business Intelligence and Analytics Platforms”, to emphasize the growing attention that organizations pay to having analysis capabilities, without needing to require help from IT or data experts.
According to Garner, “It is very likely that 2015 will be a critical year in which democratizing access to analytics will continue to dominate market requirements and stress the need for governance. Next-generation data discovery capabilities that leverage advanced analytics, but hide its complexity to simplify business user data preparation and automate pattern exploration, are likely to be more important enablers. The extent to which these emerging capabilities and trends impact buying in 2015 and beyond will determine which existing and new vendors emerge from this market transition as market leaders”. In compiling the report, Gartner surveyed 2.083 users of BI platforms.
BI and analytics trends:
- Replacing IT-centric platforms with interactive analysis techniques: the shift from using IT-centric platforms to having decentralized data discovery deployments that are spreading across the enterprise, which can be rapidly implemented and can be used both by analysts, and simple users. This is the continuation of a six-year trend of making analytics more accessible to a broader range of users;
- Cloud BI: although, during 2014, the interest in cloud BI slightly decreased, from 45% to 42% of respondents stating that they already are, or are planning, to deploy BI in either private, public or hybrid clouds, it still remains an important trend. This leads to the emergence of new market players, such as Salesforce Analytics Cloud. However, many BI and analytics leaders do not have a strategy yet for combining and integrating clouds with their existing capabilities;
- Embedding traditional reporting, dashboards and interactive analysis into business processes or applications.
- Business users and analysts are demanding access to self-service capabilities, such as sophisticated, yet accessible, data preparation tools, and faster ways to discover patterns in data;
- The need for platforms to scale and perform for larger amounts of diverse data will also continue to dominate BI market requirements;
BI and Analytics platforms capabilities in 2015:
Gartner defines BI and analytics as “a software platform that delivers 13 critical capabilities across three categories — enable, produce and consume”. For each of these areas, the company has identified the main capabilities, namely:
- Enable: Business User Data Mashup and Modeling (drag & drop, semantic auto discovery, intelligent profiling etc.), Internal Platform Integration (common look and feel, install, query engine etc. across all components), BI Platform Administration (enabling securing and administering users, Metadata Management (Tools for enabling users to leverage the same systems-of-record semantic model and metadata), Cloud Deployment, as well as Development and Integration;
- Produce: Free-Form Interactive Exploration (through manipulating chart images), Analytic Dashboards and Content, IT-Developed Reporting and Dashboards (the ability to publish multi-object, linked reports and parameters with intuitive and interactive displays), Traditional Styles of Analysis;
- Consume: Mobile (organizations can develop and deliver content to mobile devices in a publishing and/or interactive mode), Collaboration and Social Integration (users can share and discuss information, analysis, analytic content and decisions via discussion threads) and Embedded BI.
Notable changes from the previous Magic Quadrants
- If in 2013, Tableau and Qlik occupied similar positions in the Leaders quadrant and in 2014 Tableau surpassed Qlik, in 2015 Tableau stands out even more, outdoing the other Leaders, namely Qlik, Microsoft, MicroStrategy, SAS, SAP, Oracle, IBM and Information Builders;
- Two years ago, the Visionaries quadrant, dedicated to those software solutions rated as thought-leaders and innovators was empty. Then, in 2014 Alteryx and Panorama Software migrated toward this quadrant due to their high scores for innovation, market understanding and product strategy and, in 2015, Tibco Software joined them, by moving downward from the Leaders quadrant.
According to Gartner, the BI and analytics market will remain one of the fastest growing software markets which is projected to grow, by 2018, at a compound annual growth rate of 8.7%, through activities such as the expansion of data discovery, which dominates new investments, self-service data preparation, smart data discovery, cloud BI, streaming data, multi-structured data analytics, embedded BI, customer-facing analytics and data monetization, as well as collaboration and social capabilities.
References:
- Gartner, Inc. (2015), Magic Quadrant for Business Intelligence and Analytics Platforms
- Gartner, Inc. (2014), Magic Quadrant for Business Intelligence and Analytics Platforms
Image Source:

Tags: Business Intelligence, Magic Quadrant, Software Solutions
Related Posts
 Gartner releases its 2016 Magic Quadrant for BI and analytics platforms
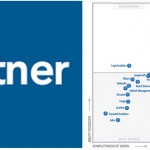 The 2014 trends in software solutions. Magic Quadrant for Business Intelligence and Analytics Platforms
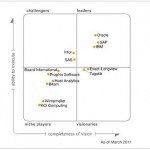 The 2011 Magic Quadrant for Corporate Performance Management Suites
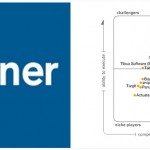 The 2010 Magic Quadrant for Business Intelligence Platforms
