Are current football metrics reflecting performance accurately?

In recent times, the use of data, statistics and analytics has flooded the sports environment, with more and more professional sports teams adopting data analysis to measure their performance. This trend has been ascending continuously since the launch of the much debated Moneyball, by Michael Lewis, which covered the deployment of statistical analysis in baseball.
Not only professionals involved in football, but the vast majority of fans of the ‘beautiful game’ are nowadays swarmed with pre and post-match statistics that are in some ways misleading.
Let’s start with the always popular % Possession statistic. Possession has been in the media spotlight, in the recent past weeks, especially due to losses recorded by Bayern Munchen and Liverpool against Real Madrid and Chelsea, respectively. Both losing sides achieved +70% possession but recorded 4-0 and 2-0 losses that gave way to a media frenzy regarding whether possession really influences the result of a football game. As it turns out, although it is believed that teams that usually rank in high possession percentages generally tend to come out on top, a very well documented article in the Telegraph, suggests that this is highly contextual and very much dependent on skill level, and maybe, even on luck on occasion.
Another problem with possession is the manner in which it is measured. Originally, possession was measured through a ‘chess clock’ approach, meaning that at the beginning of the match each team is assigned a button-clock that is pushed when the respective team is in possession of the ball. The limitations of this approach are quite obvious, especially the fact that you rely on a person to perform this tedious task. A new approach has been developed that relies on counting the total number of passes in a game and then arriving at the possession statistic by dividing the number of passes of a team to the game total. This current approach is being used by organizations that measure sports data for broadcasting companies, but it also has its own limitations. The time elapsed during dead-ball situations, out-of-play occurrences and, most importantly, inaccurate passes are not taken into consideration and this has a big influence on accurate measurement.
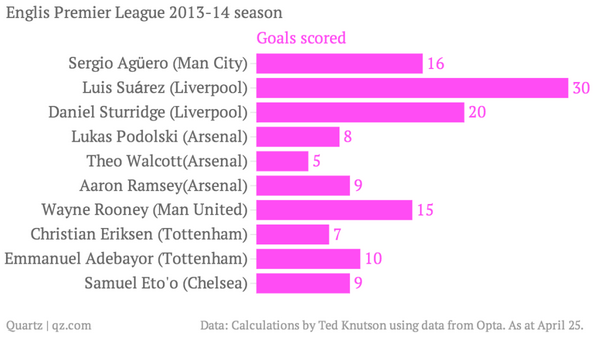
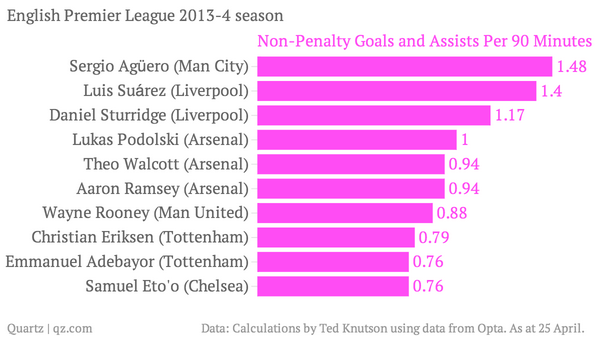
Another very important metric is # Goals scored by a player in a season or competition, but as David Altman, of the New York University, states in an interview with Quartz, this may be a less valuable player performance indicator, compared to # Non-penalty goals and assists per 90 minutes. He rightly argues that during a season playing time fluctuates and penalties cannot be attributed to skill, adding that in plenty of occasions attackers are better at offering an assist than shooting towards the goal. He makes his case by comparing these two metrics for the current English Premier League season. This analysis reveals that although Luis Suarez has scored 30 goals so far, Sergio Aguero with 16 goals is the more productive attacker with 1.48 # Non-penalty goals and assists per 90 minutes compared to Suarez’s 1.40.
Altman, who is also running a sports analysis company, North Yard Analytics, proposes that football professionals use Shapley values in order to measure a single player’s contribution to team performance. This formula deploys a series of hypothetical and inter-related measures that reflect how decisive a single actor is to the results generated by a group. The catch is that what goes into the formula for football players is not that simple and thoughtful consideration needs to be given to the subject. Nonetheless, this indicator, # Shapley value, can prove to be the metric that will enable both professionals and fans to use football statistics to gather insight, which are not obvious nowadays to neither category.
References:
- McDuling, J. (2014), The world’s most popular sport is terrible at statistics, Quartz
- Liew, J. (2014), Do football possession statistics indicate which team will win? Not necessarily, The Telegraph
- Altman, D. (2013), Introducing the Shapley Value to Football, BSports Football
Image source: