Lifelogging, taken to a whole new level: the Feltron Annual Reports
When you say Nicholas Felton, you say data visualization, performance, creativity and passion. Felton is an infographic designer, mostly known for his activity as part of Facebook’s product design team, as well as for his Personal Annual Reports. The latter compile daily measurements into graphs, maps and statistics, mirroring the year’s activities, from food and drinks to travels, communication and relationships.
Why?
As Nicholas Felton mentions on his website, the idea came in 2004, when he designed a year-end report, “Best of 04”, which included some numerical data, such as the miles traveled by plane and the number of postcards sent. The first Feltron Annual Report came out the following year, featuring information drawn from his calendar, photos and memory. As the designer himself states on his official website, this data was supposed to be relevant for family and friends only, but the report’s popularity surpassed his expectations: “Surprisingly, the report was as popular among people who had never met me as with those who knew me intimately and as a result, I have dedicated increasing amounts of time to documenting and charting the passage of each year”.
What?
On the same website, Nicholas Felton confesses that, each year, he discovers new metrics that could be measured, metrics which are, consequently, added to the next year’s report. Below are some life aspects that were assessed when compiling his Annual Reports, alongside their specific metrics, which were translated into graphical representations:
Travel
- States visited;
- Flights;
- Days spent abroad.
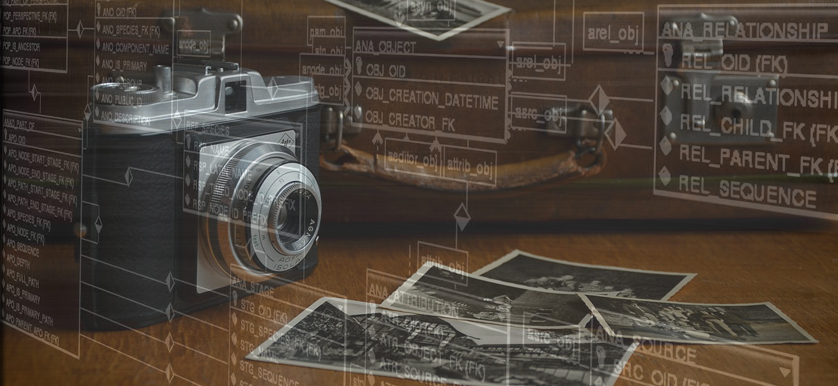
Photos
- Per countries;
- Per subject.
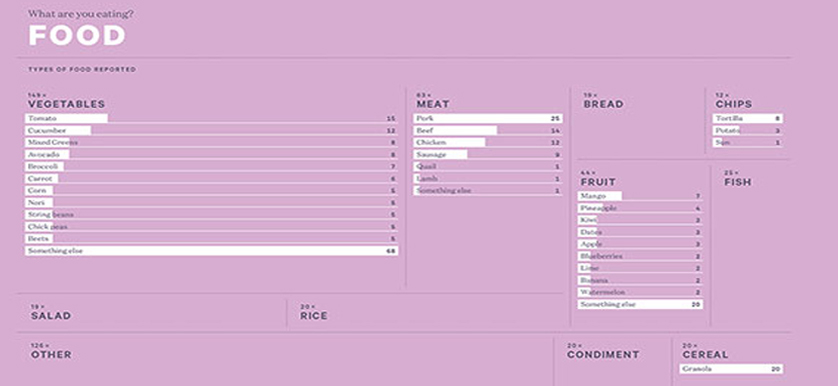
Food
- Most frequent ingredients;
- Most common preparation;
- Meals cooked.
Drinks
- Bar visit per month;
- Social drinks.
Communication
- Emails sent/received;
- Text messages sent/received;
- Postcards sent/received;
- Duration of conversations;
- Duration of phone calls;
- Facebook messages.
Sleep
- Hours asleep;
- Percentage of year spent sleeping;
- Most restful month.
Reading
- Book pages read;
- Magazine pages read.
Two of the most recent reports, namely the 2009 and the 2010 ones, differ from the others when it comes to the topic or methodology employed. In 2009, Felton’s friends, colleagues, family and simple acquaintances were asked to report on his activities when they met, and the data obtained was then used to compile the report. In 2010, Felton decided to turn his report into an encapsulation of his father’s life, who had recently passed, based on the documents, calendars and other artifacts that he possessed at the time.
How?
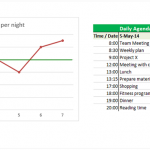
The amount of work put into generating these reports is, as one might expect, considerable. As stated on Felton’s website, two main apps were used to keep track of all the activities.
Reporter is an IOS application that Felton co-created. It enables the measurement of different aspects that would otherwise be difficult to assess. As Mark Wilson wrote for Fast Company Design, every 90 minutes the app asked Felton questions such as: Where are you? Who are you with? How productive were you today (on a scale of 1-5)?

Daytum, the other app, was also created by Felton and a partner. It collects and then communicates different life statistics.
Felton only compiles the data at the end of the year, as the purpose of these reports is to present his natural behaviors and not to influence them. However, he acknowledges the importance of tracking different activities with the purpose of improving one’s performance: “Of course, recording other metrics with Daytum starts to create feedback loops. If you can see the miles you walk daily starting to fall, then there’s an impetus to walk more” (feltron.com).
In his reports, Nicholas Felton redesigned lifelogging just like he redesigned Facebook’s timeline, telling a story about how personal data can be successfully gathered by using the proper tools and apps, efficiently monitored and, eventually, displayed in a very creative but also comprehensive manner.
References:
- Daytum (n.d.), Features
- Feltron.com (n.d.), About
- Mark Wilson (2013), Nicholas Felton Unveils His Latest Annual Report, Fast Company Design
- Nicholas Felton (2006), 2005 Annual Report
- Nicholas Felton (2007), 2006 Annual Report
- Nicholas Felton (2008), 2007 Annual Report
- Nicholas Felton (2009), 2008 Annual Report
- Nicholas Felton (2010), 2009 Annual Report
- Nicholas Felton (2011), 2010 Annual Report
- Nicholas Felton (2012), 2011 Annual Report
- Nicholas Felton (2013), 2012 Annual Report
- Nicholas Felton (2014), 2013 Annual Report
- Reporter-app (n.d.), Reporter
Image Sources:

Tags: Data Visualization, Lifelogging