Avoiding dashboard design blunders
As the benefits of performance measurement and management become broadly known, more and more organizations have implemented frameworks that includes more than the traditional lagging measures of their financial and operational performance. But squeezing a great deal of information into a small amount of space and also designing it to result in a visual display that is easily and immediately understandable by the viewer can prove to be very challenging.
In designing an effective dashboard, the pitfalls are vast and, in most of the cases, the preoccupation with superficial and functionally distracting visual characteristics results in a poorly competent visualization that does not fulfill its objectives.
Paraphrasing one of the definitions of a dashboard offered by Stephen Few in his article “Dashboard Confusion Revisited” , a dashboard is a visual display of the most important information aiding the viewer in making a quick decision, consolidated and arranged on a single screen so the information can be monitored at a glance. Some of the most common mistakes one should avoid are identified directly from this definition, for example not displaying the most important information or displays that are not arranged on a single screen.
Besides the most obvious mistakes, according to Juice Analytics, one should always start the design process with three questions in mind:
- Who is my audience?
- What value will the dashboard bring?
- What type of dashboard needs to be created?
So what can go wrong when designing dashboards?
1. Bearing the above mentioned questions in mind, one of the first mistakes that usually occurs, emphasized by Stephen Few in his book “Information Dashboard Design: Displaying Data for At-a-Glance Monitoring” is starting off with too much complexity. When provided with the opportunity, for the optimistic ones, or when confronted with the task of designing a dashboard, it is very easy to get exceedingly determined and aspire to a highly detailed and real-time KPI monitoring dashboard and provide the user with overwhelmingly numerous drill-down options to get to the core of the presented data.
2. According to Few, too much complexity can lead to a fragmentation of the data into separate screens. It can happen in two ways: data is separated either into screens to which one must navigate, or into different instances of a single screen that are accessed by the viewer through some form of interaction. This is not necessarily all bad – allowing the viewer to navigate to further details or to a different visual representation that best achieves its purpose by standing alone can be quite a powerful tool for a dashboard. For example, allowing the user to deep dive into a certain KPI that is influential for others and view the data split in different ways.
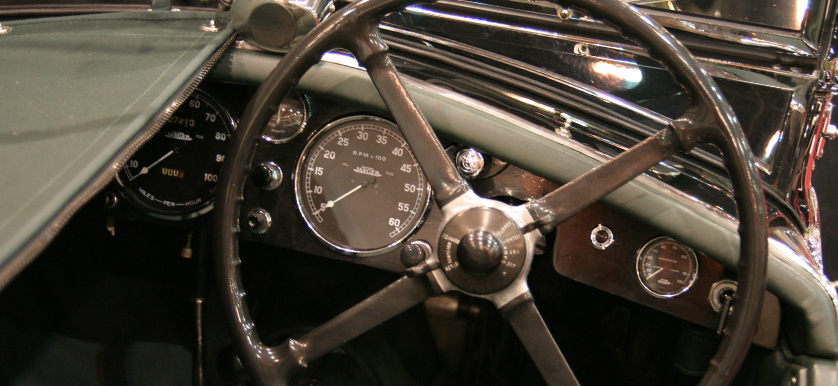
3. Another very common mistake, identified by the same author, is to use gadgets or widgets that lack in bringing context for the data. This usually happens with speedometers, gauges and others. These visuals of what is going on with a particular KPI rarely do a good job as a solo act, they need a good supporting cast to succeed. They do not provide a clear benchmark with other indicators, or a clear overview in time – on track/ better than in the past/ worse than forecasted.
4. In designing the dashboard, some hesitate to use the same type of visual representation of a KPI multiple times. This may be due to the desire to create a design in such a manner as not to bore the viewer. According to Stephen Few, variety is recommended, but with a certain limit. By introducing meaningless diversity of visual representations, the dashboard display may end up full of different visual designs that have nothing in common. One should select the means of display that work in favor of the information intended for representation. This should offer the viewer the information he requires in the most direct and easily understandable manner. If the information is clearly displayed it will not bore the viewer, just because it uses the same design as the previous KPIs, but it rather comes in his aid, as it enables him to quicker benchmark between different KPIs by using the same intuitive, non-cognitive reading strategy, which saves him thinking time and energy.
5. One of the most common mistakes in designing a visual representation to indicate the value of any KPI is not starting from a zero basis. This can create a distorted view of the data generating, a significant discrepancy between the real value of the KPI and the perception of the values. You can read more about this in “How data visualization (mis)informs”.
In his article “Dashboard design for rich and rapid monitoring”, Stephen Few summarizes the most relevant best practices in designing dashboards, aspects that he also took into consideration when judging the Data Visualization Competition, such as:
- Information displayed on a single screen, so people should not move between screens or scroll around on a single screen to see all of the information;
- The display media used, such as graphs, which communicate performance information directly, clearly, accurately, rapidly, and with enough context to make the visualization meaningful;
- Visual emphasis on the information that most requires the viewer’s attention;
- An arrangement of the information that is logical and in accordance with the target audience;
- Greater focus on what is currently happening rather than what happened in the past;
- An aesthetically pleasing display.
By taking these pitfalls into consideration, one should be provided with a significant aid in creating a better visual representation of the information. Designing a dashboard is harder than an individual graph, as a dashboard combines a large collection of information from different KPIs, which can easily become cluttered. In order to craft a dashboard design that communicates information rapidly and clearly, great care and skill are required.
References:
- Few, S. (2006), Dashboard design for rich and rapid monitoring, Perceptual Edge
- Few, S. (2007) Dashboard Confusion Revisited, Perceptual Edge
- Few, S. (2013), Information Dashboard Design: Displaying Data for At-a-Glance Monitoring, Second Edition
- Juice Analytics, (2009), A guide to creating dashboards people love to use
Image source:

Tags: Dashboard, Data Visualization