Microsoft Business Intelligence tools: how to get the best value out of Dashboards

Business Intelligence and Performance Management make a great pair when it comes to generating value for organizations worldwide. Selecting a Business Intelligence framework that can accurately outline performances of our organizations makes for an excellent common practice in today’s technologically enabled business environment.
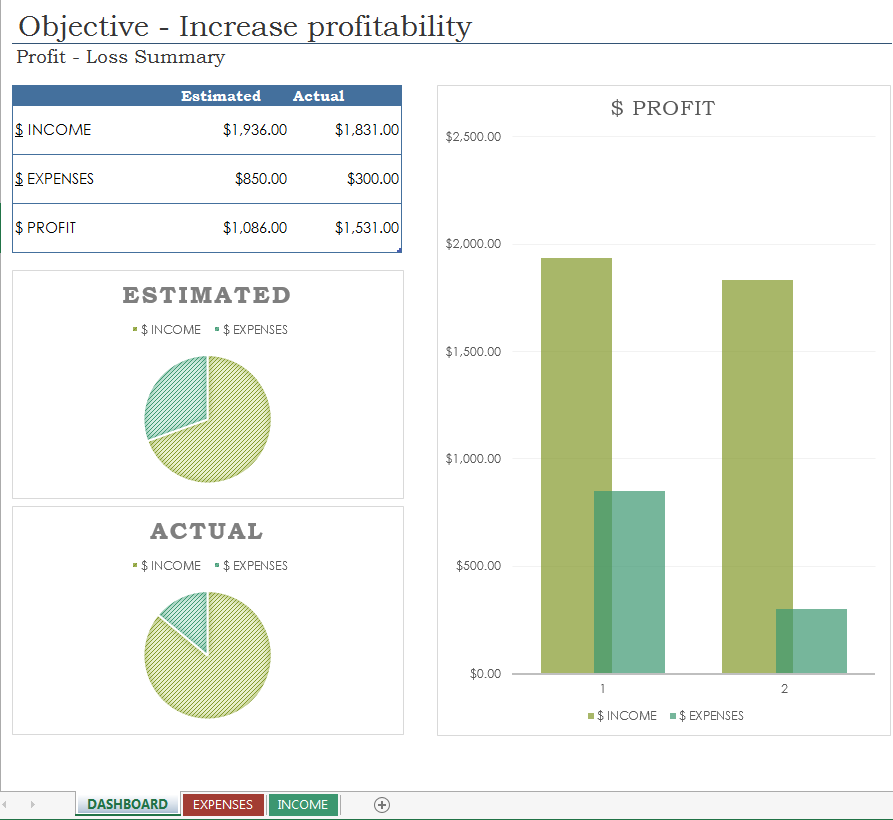
When it comes to performance management, dashboards are the ideal tools to visualize data and support decision making. A Business Intelligence framework is architected in a manner that enables computer-based dashboards to provide an integrated view of an organization’s performance. Data is the most important aspect of the dashboard developing process. What should not be overlooked, though, is the balance between making a dashboard attractive and keeping the data relevant in its design.
SharePoint and Excel are the most frequently used Microsoft Business Intelligence tools of today. While Microsoft Excel provides ideal features for both numerical and graphic display, the SharePoint server allows organizations to not only create dashboards, but also keep your information up to date in a centrally managed, easy accessible location. The complex functions of both Microsoft Excel and SharePoint enable the user to add value to the components of any dashboard. These features make them suitable for individuals, teams, groups, or an entire organization.
When using Microsoft Excel to develop a dashboard, managers can start with creating a background in order to draw more focus on the constituent elements of the Dashboard. Once executives have formulated their objectives, they can use Excel’s conditioning formatting to design simple tables and charts. Performance indicators can be clustered by use of color, proximity and enclosure. Data interpretation can be achieved by use of statistical analysis, although audience profile should be regarded when presenting the data. The flexibility of Microsoft Excel allows organizations to incorporate one or more reports into the Dashboard, while also providing the right format for complementary performance scorecards.
When using Microsoft SharePoint Server, organizations have several tools available to create dashboards. For example, dashboards can be created by using PerformancePoint Dashboard Designer or by using the SharePoint Server. PerformancePoint Dashboard Designer is a tool that organizations can use to create powerful, dynamic dashboards that are hosted in the Microsoft SharePoint Server. The PerformancePoint Dashboard Designer is divided into four functional areas:
- The Ribbon: contains the basic commands for creating, editing, updating, and publishing scorecards, reports, and dashboards.
- The Workspace Browser: used to work with Dashboard Content (or PerformancePoint Content) and Data Sources.
- The Center Pane: enables the user to visualize, create, and modify dashboard items.
- The Details Pane: used to add or change the content of one particular dashboard item.
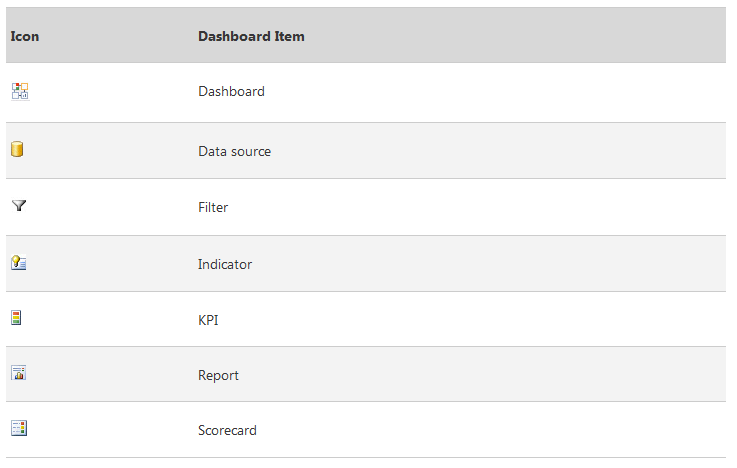
The interesting thing about Microsoft PerformancePoint Dashboard Designer is that the dashboard items – data source, filter, indicator, KPI, report, and scorecard – are associated with icons that help the user navigate through the dashboard content. Reporting on performance with The PerformancePoint Dashboard Designer can be achieved by creating categories such as Measures, Dimensions, or Named Sets. The PerformancePoint Dashboard Designer also contains a Scorecard. By viewing the status of key performance indicator on a scorecard, executives can assess the performance of the organization against those indicators.
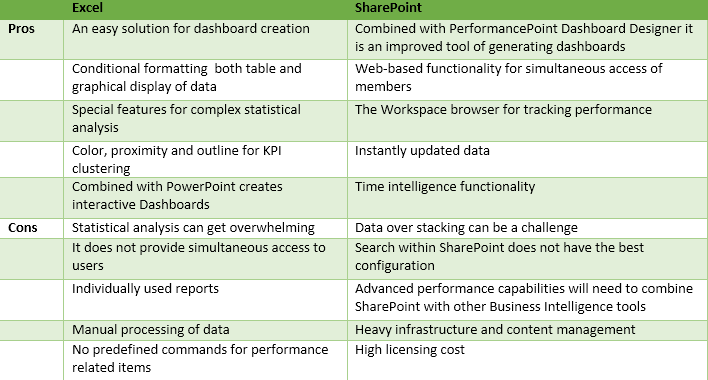
For a more concise perspective on Microsoft Excel and SharePoint, the following table shows the main pros and cons of both Business Intelligence tools:
Microsoft PowerPoint is an ideal Business Intelligence tool that adds interactivity to an organization’s dashboards. Handling Microsoft PowerPoint does not require specialized expertise, although some details must be taken into consideration when organizing dashboards on slides. It is recommended that dashboard charts are on the exact same axes. By using Microsoft PowerPoint, yearly progression of performance indicators within the dashboard can be drilled down to detailed slides for an interactive visualization of the selected indicators. However, if this particular method is chosen, users should make sure that chart axes are consistent across all slides, so that comparison of data is unambiguous.
The use of Business Intelligence tools such as Microsoft Excel, PowerPoint, SharePoint or PerformancePoint Dashboard Designer can provide the adequate medium for value add which is useful when creating performance dashboards. Reporting on performance can be significantly improved by the ready-to-use functionalities of Microsoft Business Intelligence Tools, which make the process of managing relevant data more efficient and less time consuming.
Reference:
- Microsoft (2014), Getting started with dashboards
- Microsoft (2014), Interactive dashboards using PowerPoint and Excel
- Microsoft (2014), Create a basic Performance Point dashboard
Image Source: