As it goes, discussing team performance and performance management gives due attention to means and measurements that address staff qualities. This is understandable, as a great part of the overall productivity is attributed to the quality and effort invested by team members into their work. Also, there is a reasonably larger number of team members, than there are team managers and leaders. This assumption provides a healthy premise for investing in research that aims for boosting performance through stimulating staff qualities. Nevertheless, when discussing team efficacy, one cannot and should not overlook the effect team leaders have on the overall performance.
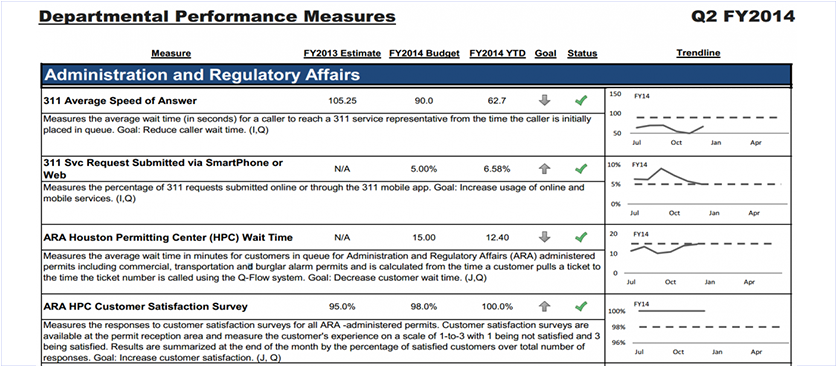
“Open data will encourage civic involvement and increase the pace of innovation in the city.” These are the words of Mayor Parker, who strongly believes that a more transparent approach towards reporting public performance will support Houston’s development.
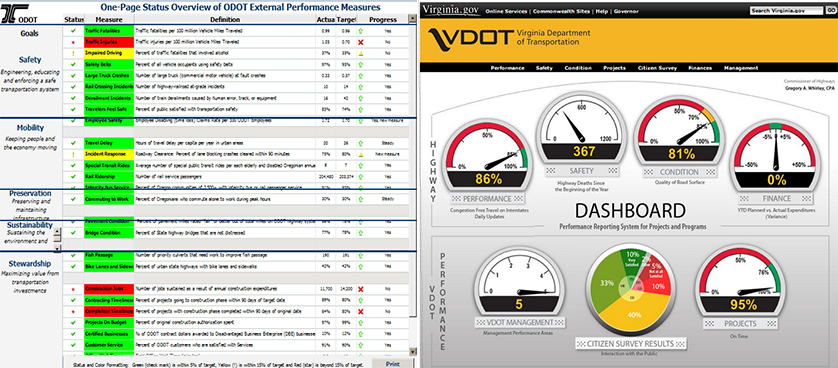
Dashboards are visual representations of the company’s performance. As an operational tool, it illustrates the most relevant information for decision making. Their core objective is to consolidate on a single screen the most important KPIs, in order to monitor data at a glance.
In the world of Performance Management, these two terms are often confused and sometimes used interchangeably. Although they both aggregate data across business units and give the reader the opportunity to monitor performance, there are important distinctions to be noted between Scorecards and Dashboards.
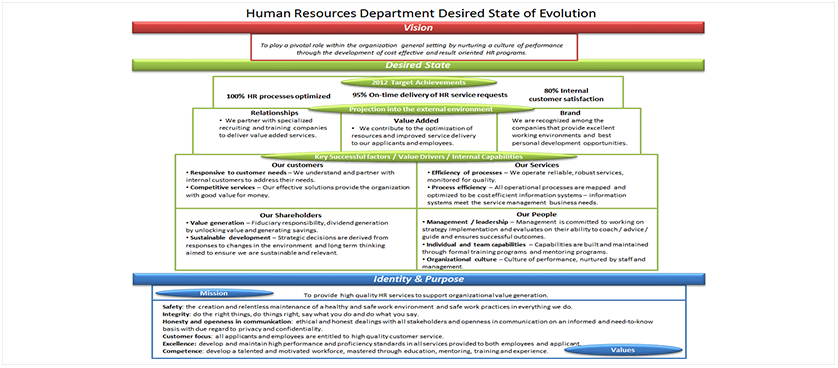
The Desired State of Evolution is a performance management tool used to integrate all strategic statements of an organization. Having the structure of a pyramid, the Desired State of Evolution closes the gap between mission and vision, by integrating in the middle of the pyramid the progress at which the company aims, the “destination statement”. (Lawrie and Cobbold, 2004)