What Is a Key Performance Indicator (KPI)? Definition, Framework, Resources, and 1000+ Examples


A Key Performance Indicator (KPI) is a measurable expression of the achievement of a desired level of results in an area relevant to the evaluated entity’s activity. This is the definition used by The KPI Institute, a global research, training, and consultancy organization with more than 22 years of experience in performance management.
In practical terms, a KPI is a measure used to evaluate progress toward an important organizational, departmental, team, or individual objective. A KPI is not simply any number an organization can track; it is a measure selected for its relevance to a desired result and its usefulness in evaluating and improving performance.
This guide examines:
- What makes a measure a KPI and how the concept is defined within The KPI Institute’s performance management framework
- How KPIs differ from metrics, measures, Performance Indicators (PIs), and Key Risk Indicators (KRIs)
- How KPIs operate at corporate, departmental, team, and individual levels and connect performance to organizational objectives
- Why KPIs matter for clarity, focus, improvement, engagement, communication, and organizational learning
- The different types of KPIs, including leading and lagging indicators, strategic and operational KPIs, and count, percentage, and monetary measures
- How KPIs fit within the Balanced Scorecard and its four perspectives for measuring and managing organizational performance
- How to formulate a good KPI, from defining the objective to applying SMART criteria
- How the KPI lifecycle works, including the establishment, use, review, and evolution of KPIs
- Practical KPI examples by department, covering finance, human resources, sales and marketing, operations, and IT and service management
- Common KPI mistakes and the performance management practices that can help organizations avoid them
What Is a Key Performance Indicator (KPI)?
The most cited definition of a KPI comes from The KPI Institute. The Institute defines a KPI as “a measurable expression for the achievement of a desired level of results in an area relevant to the evaluated entity’s activity.”
Break that down and three things stand out. First, a KPI has to be measurable. Second, it points to a desired result, not just an observation. Third, it only counts if it sits in an area that matters to whoever is being measured, whether that’s a company, a department, a team, or a single employee.
A KPI is not a stand-in for “anything you can count.” Website visits, email opens, or the number of meetings held in a week are data points. They only become KPIs once they connect to a specific objective and someone acts on the result. That connection to strategy is what separates a KPI from ordinary business data, and it’s also the single most common thing organizations get wrong.
KPIs Operate at Multiple Levels
A KPI rarely stands alone. It usually sits inside a chain that runs from the boardroom down to a single desk.
- Corporate level: KPIs here back strategic alignment and executive decisions. Think $ Revenue Growth or % Market Share.
- Departmental level: KPIs guide functional effectiveness inside a single team, such as % On-Time Delivery in operations or % Retention Rate in HR.
- Individual level: Personal KPIs connect one person’s work to the bigger goal, such as # Projects De9/3/2026Slivered On Time for a project manager.
When these three levels are built correctly, a frontline employee can trace a straight line from their own KPI to a strategic objective on the board’s scorecard. That line of sight is one of the clearest signs of a mature performance system, and its absence is one of the clearest signs of a broken one.
KPI vs. Metric vs. Measure vs. Indicator
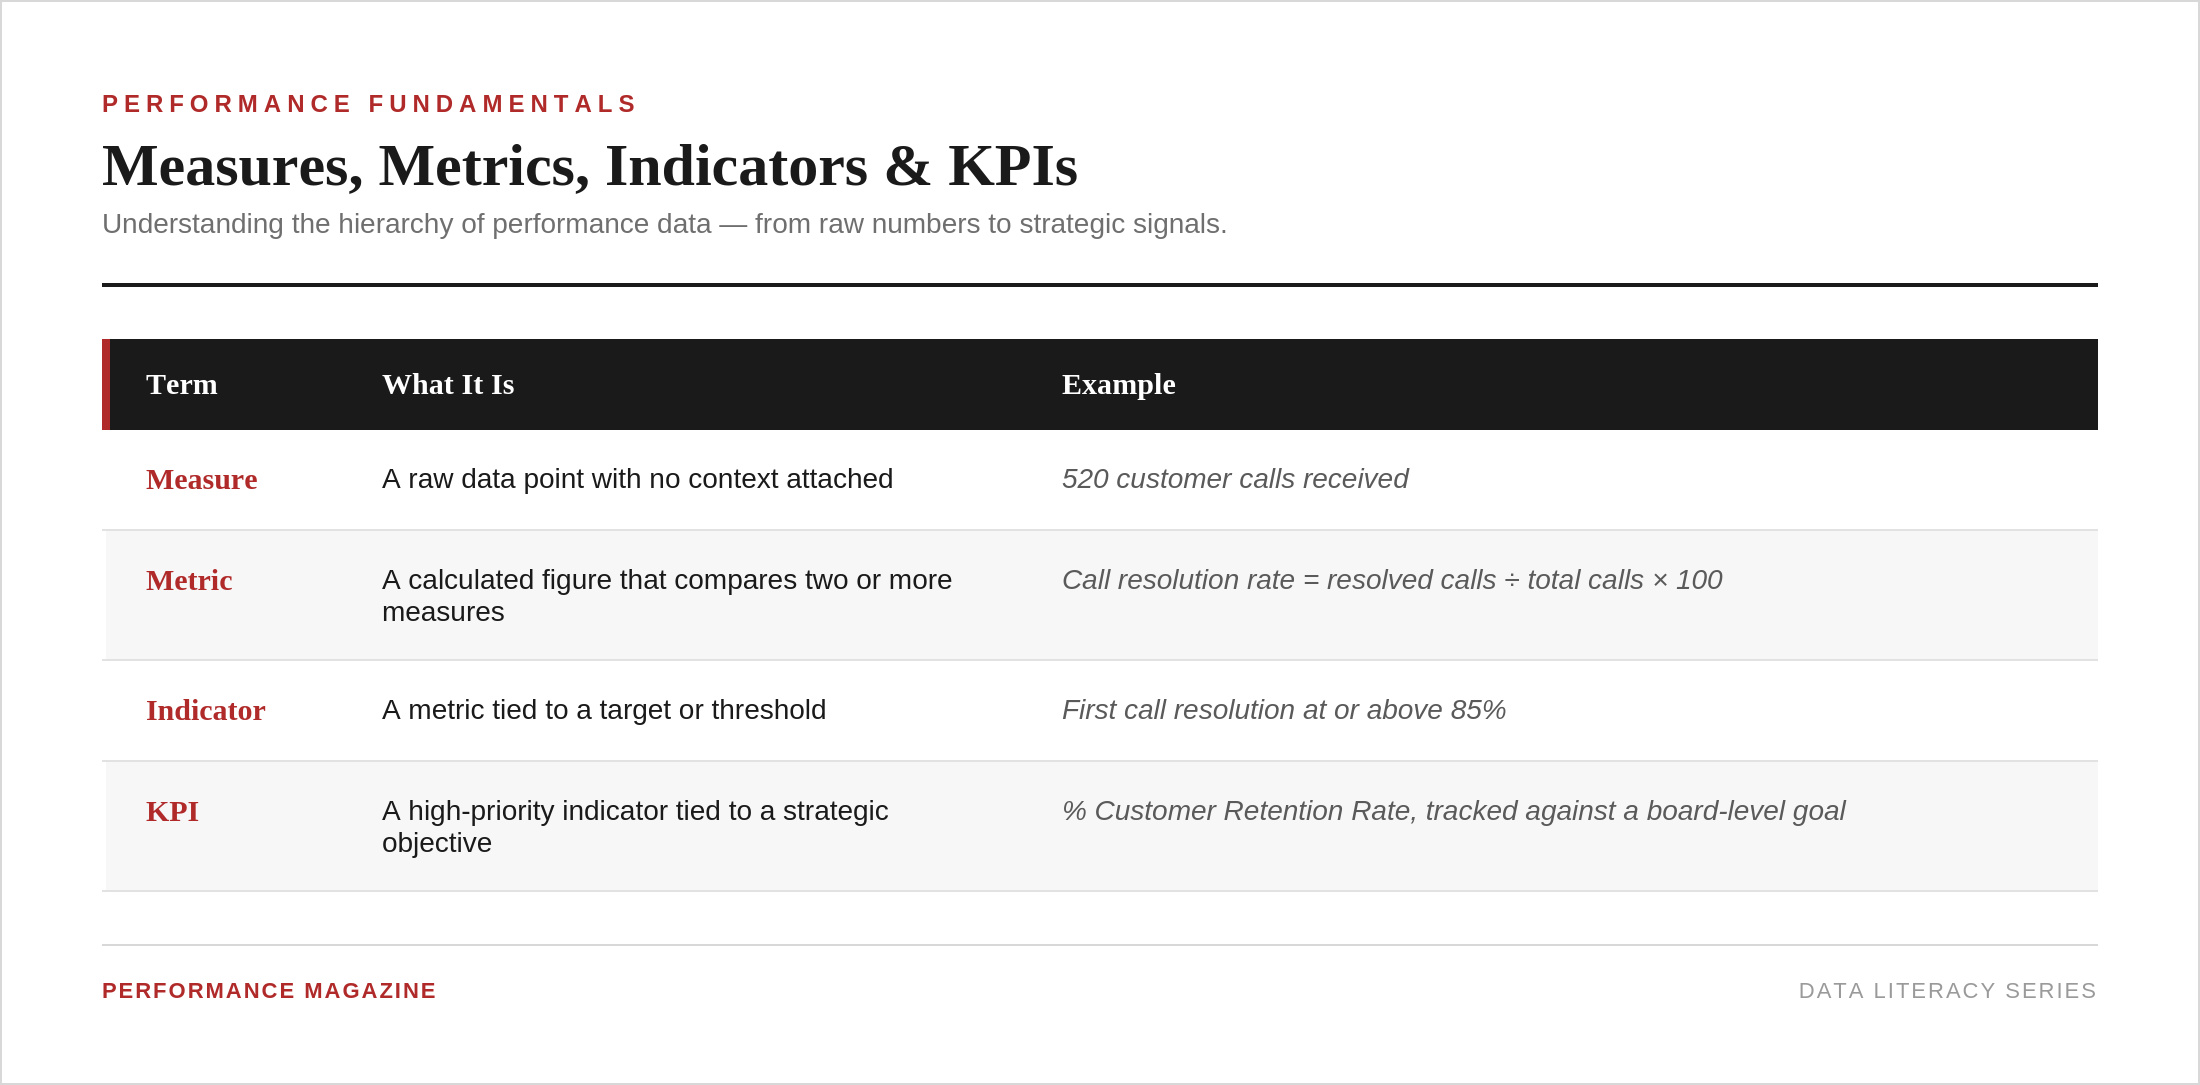
These four words get used as if they mean the same thing. They don’t, and mixing them up is one of the fastest ways to end up with a bloated, confusing dashboard.
Data moves up this chain: from raw measure, to metric, to indicator, to KPI. Most organizations track hundreds of metrics. Very few of those metrics deserve KPI status, because a KPI is reserved for the handful of numbers senior leadership actually uses to make decisions.
Where KRAs, PIs, and KRIs Fit In
The KPI Institute’s Body of Knowledge places KPIs inside a wider hierarchy of performance terms. Getting this right matters for anyone building a scorecard or a reporting structure.
- Key Result Area (KRA): A broad domain where an organization has to perform well, such as Customer Experience or Operational Efficiency. A KRA is not measurable on its own; it needs indicators underneath it.
- Key Performance Indicator (KPI): A high-priority, strategically significant measure tied to a KRA and reported to senior leadership.
- Performance Indicator (PI): A supporting measure, relevant at the team or process level but not critical enough to reach the executive scorecard. Think # Daily Orders Processed rather than % Customer Retention Rate.
- Key Risk Indicator (KRI): A forward-looking measure that flags a threat before it damages performance. Where a KPI asks “are we hitting our goals,” a KRI asks “what could stop us.”
Together, these terms form a structure that runs from strategic intent down to the data behind a single report. Companies that skip this structure tend to end up with dashboards full of numbers nobody uses.
Why KPIs Matter
A KPI is worth building only if it changes behavior. The KPI Institute’s research points to six areas where well-designed KPIs pay off.
- Clarity. A KPI turns a vague ambition like “get better at customer service” into something concrete, such as % First Call Resolution. Teams stop guessing at what success looks like. Example: a retail chain that tracks $ Sales per Square Foot gets a single number that lines up real estate, merchandising, and store operations around one shared measure of location performance.
- Focus. With a small set of KPIs in place, attention goes to what actually drives results instead of spreading across everything that can be counted. Example: a hospital that tracks # Average Patient Wait Time channels staff effort into the specific process fixes that shorten delays.
- Improvement. A KPI trending in the wrong direction is a prompt for action, whether that means a root-cause review or a new initiative. Example: a software company watching # Issue Resolution Time climb can launch a code review process before customer satisfaction takes the hit.
- Engagement. Employees who can see how their daily work moves a KPI tend to feel more ownership over the outcome than employees who only hear about targets secondhand. Example: a call center agent measured on % First Call Resolution understands their effect on customer loyalty, not just call volume.
- Communication. KPIs give departments and executives a common language, which cuts down on the back-and-forth that happens when everyone reports numbers differently. Example: an ESG report built around # CO₂ Emissions per Product tells shareholders and customers a consistent story about environmental performance.
- Learning. Over time, KPI trends and benchmarks become a record of what worked and what didn’t, and that record is worth more the longer an organization keeps it. Example: a marketing team reviewing a falling $ Cost per Lead across several campaigns can trace which tactics worked and repeat them.
Types of KPIs
KPIs get classified a few different ways, and it helps to know all three.
By timing. Leading indicators predict future performance (# Sales Pipeline Opportunities). Lagging indicators confirm what already happened (% Net Profit Margin). A balanced scorecard needs both, because leading indicators alone can be unreliable, and lagging indicators alone arrive too late to act on.
By scope. Strategic KPIs sit at the corporate level and matter to the board. Operational KPIs track a specific process or team, often on a weekly or monthly cycle, and roll up into the strategic picture.
By format. The KPI Institute’s naming convention tags every KPI with a symbol that signals what kind of number sits behind it:
- # (count): # New Clients, # Incidents Resolved
- % (rate or proportion): % Customer Satisfaction, % Employee Turnover
- $ (monetary figure): $ Revenue per Employee, $ Cost per Unit
This small convention does a lot of work. Anyone who looks at a dashboard can tell at a glance whether they’re looking at a count, a rate, or a dollar figure, without reading the full label.
The Balanced Scorecard: Where Most KPIs Live
Kaplan and Norton introduced the Balanced Scorecard in a 1992 Harvard Business Review article as a way to measure performance beyond financial results alone. It groups KPIs into four perspectives:
- Financial: Revenue Growth Rate, Net Profit Margin, Return on Investment
- Customer: Customer Satisfaction, Net Promoter Score, Customer Retention Rate
- Internal Process: Process Cycle Time, Error Rate, Time to Market
- People, Learning & Growth: Employee Engagement Score, Training Hours per Employee, Internal Promotion Rate
By 1996 the same framework had already expanded from measurement into strategy execution. Most modern KPI frameworks, including The KPI Institute’s own, still lean on this four-perspective structure because it forces a company to look past the income statement.
How to Write a Good KPI
The KPI Institute recommends a consistent naming pattern that keeps objectives, KPIs, and initiatives from blurring together:
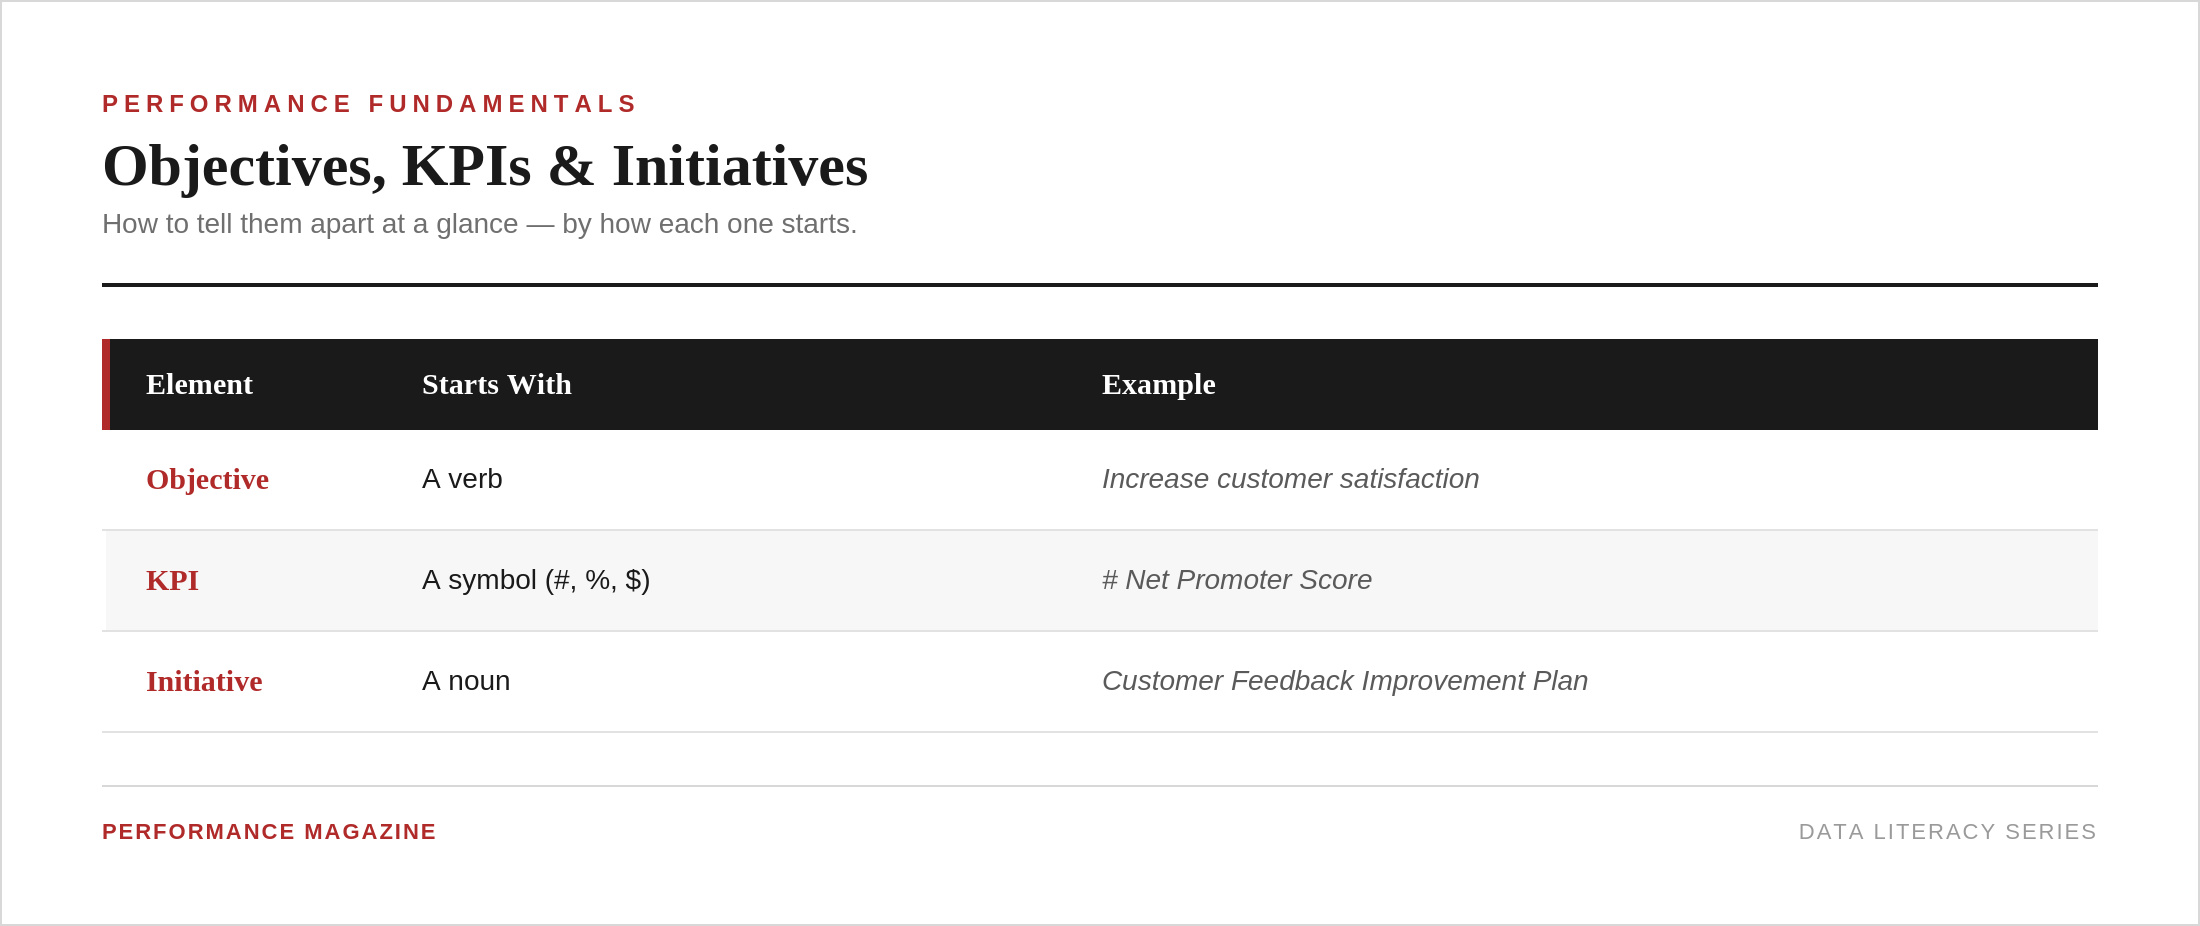
Once the objective is set, the KPI itself should meet the SMART test:
- Specific: It measures one clear thing, not a vague ambition.
- Measurable: The data behind it can be collected consistently.
- Achievable: The target is a stretch, not a fantasy.
- Relevant: It ties back to a real strategic priority, not a number that’s just easy to pull.
- Time-bound: It has a reporting frequency and a deadline attached.
A KPI that fails even one of these tests tends to get ignored within a quarter.
The KPI Lifecycle
KPIs are not set-and-forget. The KPI Institute’s Body of Knowledge describes three stages every KPI moves through:
- Establishment. The organization selects the KPI, documents it, and puts data collection in place.
- Use. Data flows in on a regular cadence, and the KPI feeds into real decisions and reporting.
- Evolution. Over time, a KPI is kept as-is, refreshed to stay relevant, suspended once it stops adding anything useful, or replaced by a more advanced measure. % Customer Satisfaction, for example, is often superseded by # Net Promoter Score as an organization matures.
Many companies skip the evolution stage, and that’s one of the most common mistakes in performance management. Plenty of organizations still track KPIs that made sense five years ago and haven’t been reviewed since.
KPI Examples by Department
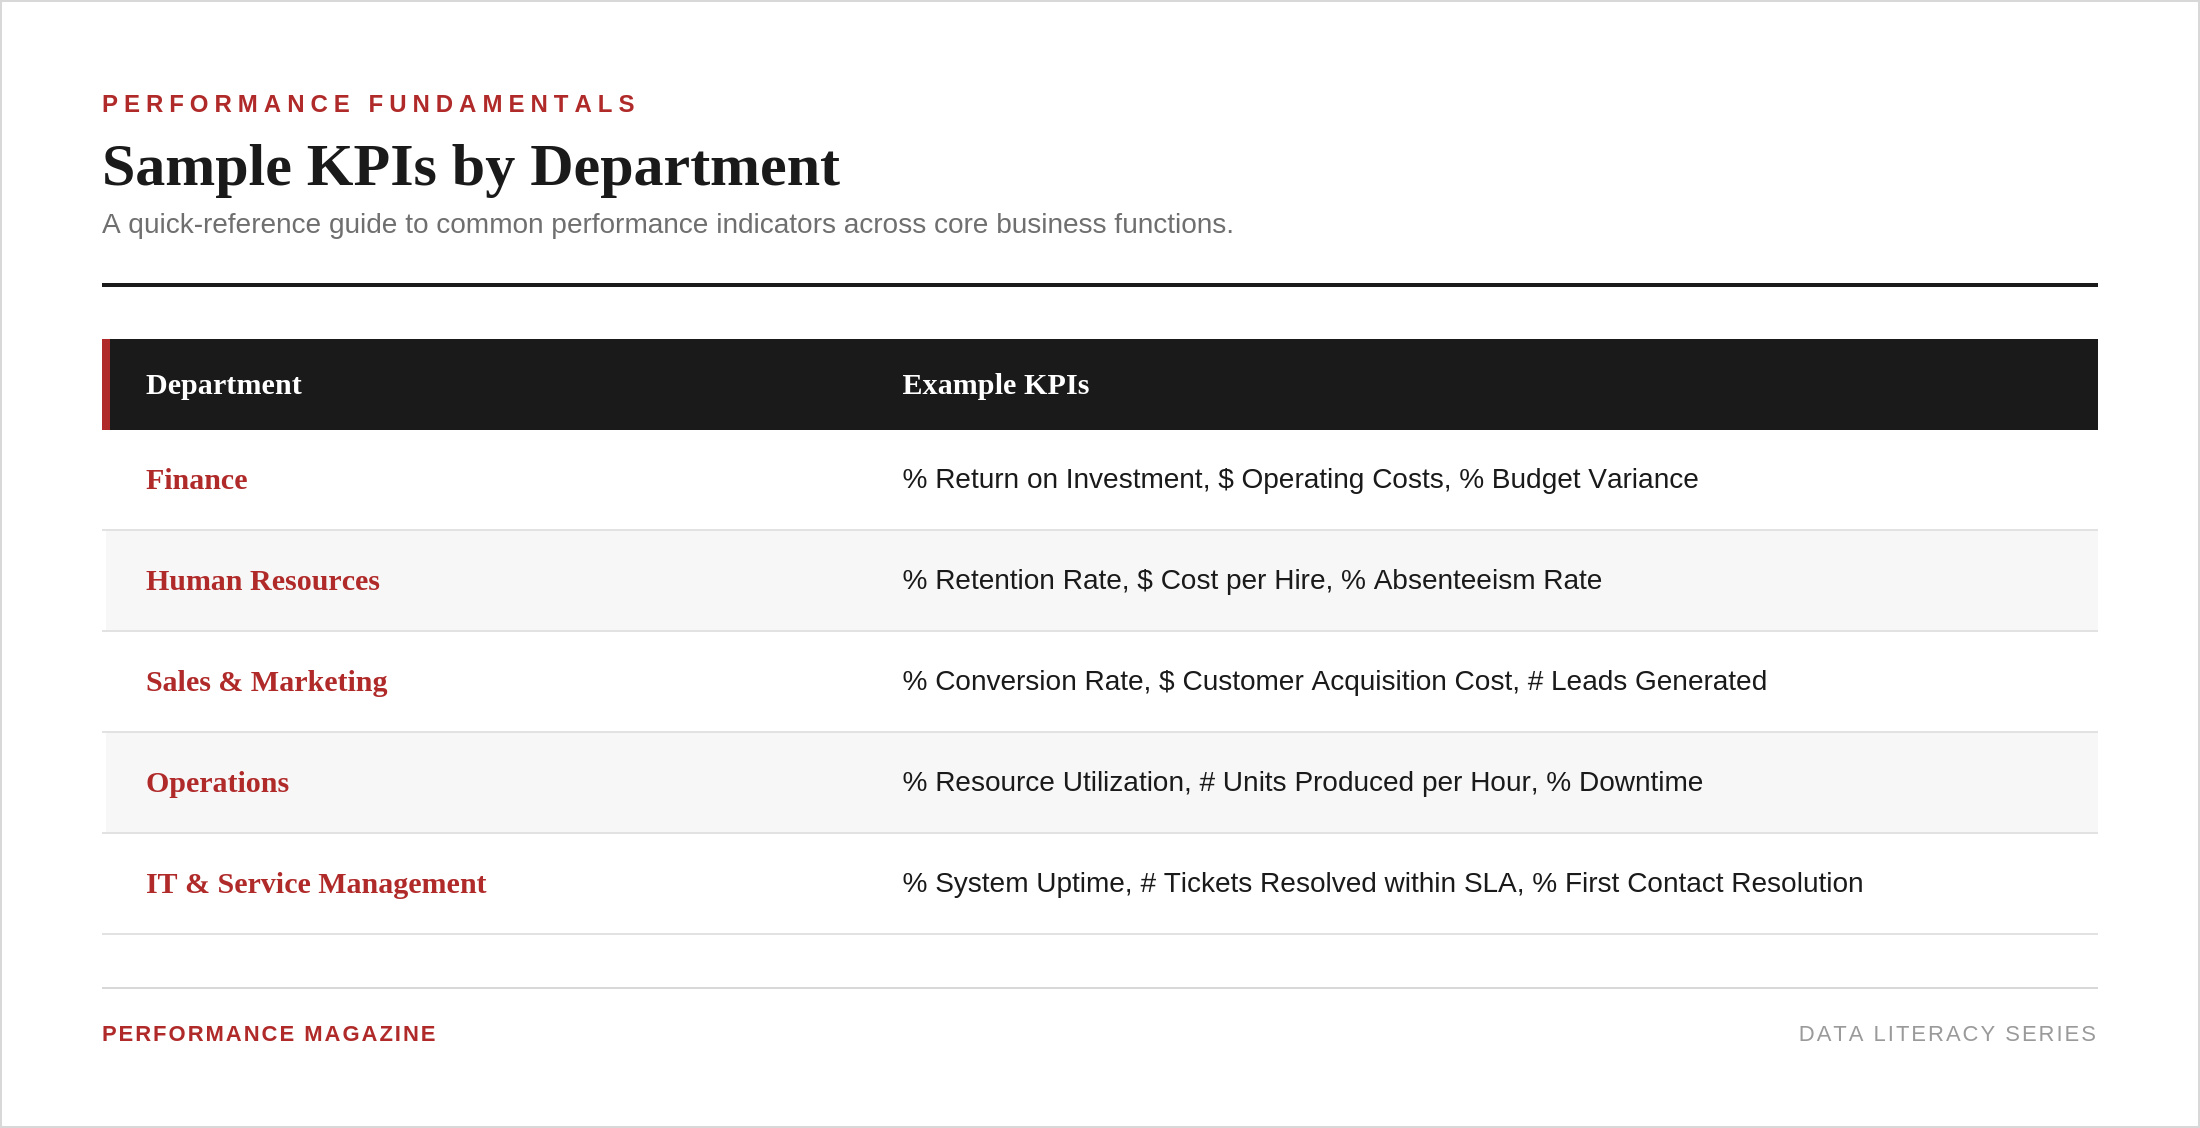
Most of these work best in combination rather than alone. Tracking # Tasks Completed alongside % Tasks Completed on Time and $ Value Generated per Task gives a fuller read on performance than any single number can.
Performance Measurement vs. Performance Management
These two terms get treated as synonyms, and they shouldn’t be. Neely et al. (1995) define a performance measurement system as a set of metrics used to quantify the efficiency and effectiveness of actions. Forza and Salvador (2000) go further, describing it as an information system that supports two functions: structuring communication around target setting, and collecting, processing, and delivering data on how people, processes, and business units are performing.
Performance measurement deals with the evaluation of results. Performance management deals with what happens next: the decisions, initiatives, and behavior changes built on top of that evaluation. One tracks the score. The other decides what to do about it.
The Balanced Scorecard is a good illustration of how the two ideas merge over time. Kaplan and Norton introduced it as a measurement tool in 1992. By 1996 it had grown into a strategic management system. By 2008 it sat inside a wider system for planning, execution, and organizational learning. A tool built to measure performance turned, over 16 years, into a system built to manage it.
Common KPI Mistakes
A few problems show up in nearly every organization that struggles with KPIs:
- Measuring everything. Dashboards that carry 40 metrics dilute attention instead of sharpening it. A KPI list should be short enough that people remember it without looking it up.
- Skipping alignment. When department KPIs aren’t linked to corporate objectives, teams end up optimizing for numbers that don’t move the business forward as a whole.
- Weak documentation. A KPI without a documented formula, data source, owner, and reporting frequency is open to different interpretations by different people, and that alone can undermine trust in the number.
- Stale data. A KPI that shows up weeks after the fact turns into a post-mortem rather than a tool for a live decision.
- No data governance. Someone has to own data quality for each KPI, from the source system down to how often it gets refreshed. Without a named data custodian, small errors in a spreadsheet quietly turn into board-level decisions built on bad numbers.
Most of these mistakes trace back to the same root cause: a KPI system built around what’s easy to pull from an existing report, rather than what the organization actually needs to know.
Frequently Asked Questions
- What does KPI stand for? KPI stands for Key Performance Indicator: a measurable value linked to a specific strategic or operational objective.
- What is the difference between a KPI and a metric? A metric is any calculated figure built from raw data. A KPI is a small subset of metrics selected because it ties directly to a strategic goal and gets used by decision-makers. Every KPI is a metric, but not every metric is a KPI.
- How many KPIs should an organization track? There’s no fixed number, but most performance management practitioners recommend keeping the list short, often somewhere between five and fifteen at the corporate level. More than that and the system tends to lose focus.
- What makes a good KPI? A good KPI is specific, measurable, tied to a real objective, and something the organization can act on. If a KPI can’t change a decision, it’s not doing its job.
- Is revenue a KPI? Revenue can be a KPI if it’s tied to a specific strategic target, such as $ Revenue Growth against a year-end goal. Without a target or an owner, it’s closer to a raw financial metric.
- Who is responsible for setting KPIs in an organization? Top management sets the strategic direction and signs off on major KPIs, but the day-to-day design usually sits with a strategy or performance office, and department heads take ownership of the KPIs specific to their teams.
- What is the difference between a KPI and a KRI? A KPI tracks progress toward a goal. A Key Risk Indicator (KRI) tracks the likelihood of something going wrong before it happens. Mature performance systems track both side by side.
- What is the difference between a leading and a lagging KPI? A leading KPI predicts future performance, such as # Sales Pipeline Opportunities. A lagging KPI confirms a result that already happened, such as % Net Profit Margin. Leading indicators give teams time to act; lagging indicators tell them whether that action worked.
- Can a KPI change over time? Yes, and it usually should. The KPI lifecycle covers exactly this: a KPI gets maintained while it’s still relevant, refreshed when its calculation needs adjusting, suspended once it stops adding anything useful, or replaced by a more advanced measure as an organization matures.
- What is the difference between a KRA and a KPI? A Key Result Area (KRA) is a broad domain, such as Customer Experience or Financial Performance. It isn’t measurable by itself. A KPI is the specific, quantifiable measure placed underneath a KRA to track progress inside that domain.
Where to Go From Here
For a deeper look at any single part of KPI management, from documentation templates to lifecycle management to industry-specific examples, see:
- [Watch] Key Performance Indicators: The Core of Performance Management Systems – Compare KPIs and other performance evaluation criteria, identify the common KPI pitfalls, and discover how to use KPIs to create synergies between departments.
- How Can You Improve the Data Gathering Process for Your KPIs? – “An important component of performance measurement is represented by the data collection capability. However, when applied in the organizational context, this process is neither easy nor lacking obstacles, as practitioners often discover.”
- How Can We Ensure Our KPIs Are Aligned With the Strategy? – “In many cases, the key performance indicators (KPIs) monitored do not seem relevant as they are not connected to the strategy. To better understand how this problem can be addressed, we must first identify its possible causes.”
- How to Implement a KPI Measurement Framework – “A KPI implementation project plan provides a structure for the implementation of an organization’s performance management system. Once the project plan is set, all types of activities would have a clear deadline and designated responsibilities.”
- Project Plan: Developing a Performance Management System Based on KPIs – “When formalizing and implementing a performance management system (PMS) based on key performance indicators (KPIs), there are multiple activities to be considered and many stakeholders to be engaged in the process. Therefore, you’ll need a project plan to make performance management an ongoing process within your organization.”
- [Watch] KPI Selection Techniques – “Learn how KPI selection techniques can be implemented in practice and gain insights into the best practices for selecting KPIs.”
- Advice on KPI Selection – “KPI selection is a process which seems simple, yet is inherently complex, due to the interdependencies involved. Here are 15 things to consider before embarking on this journey.”
- [Watch] Overcoming KPI Selection Challenges: Applying KPI Selection Techniques – “What are the most important guidelines to follow when selecting KPIs for strategic objectives? What are the most efficient KPI Selection techniques, most recommended KPI selection environments, and some Value Flow Analysis technique examples?”
Additional Resources: KPI Examples
- KPI of the Day – Business Consulting (BC): $ Revenue by Practice
- 50+ KPI Templates, Scorecards, and Dashboards for Measuring Business Success
- [Download] The KPI Compendium: 20,000+ Key Performance Indicators Used in Practice
- [Download] The Production and Quality Management KPI Dictionary: 180+ Key Performance Indicator Definitions
- [Download] The Local Government KPI Dictionary: 660+ Key Performance Indicator Definitions
- [Download] The Top 25 Project Management KPIs – 2020 Extended Edition
- [Download] KPI of the Month: % Customer Retention
KPIs are not just about understanding and working with numbers. Using KPIs requires stakeholders to fulfill a vision and commit to ensuring success across all levels of their organization. If you would like to learn how to select the right KPIs for your organization, sign up for The KPI Institute’s Certified KPI Professional and Practitioner live online course today.
*********
Editor’s Note: This guide draws on The KPI Institute’s more than 20 years of research, expertise, and practical experience in performance management. Its core definitions, terminology, and frameworks are grounded in the Institute’s forthcoming KPI Body of Knowledge, developed under the leadership of Marcela Presecan, Head of Research at The KPI Institute.