ACSI’s Smartphone Customer Satisfaction Survey delivers great news to Samsung
The customer satisfaction benchmarks are based on randomly sampled interviews with current smartphone users. The study expands ACSI coverage of the cell phone industry to provide ACSI clients with detailed customer satisfaction data at the brand level for the rapidly growing smartphone market.
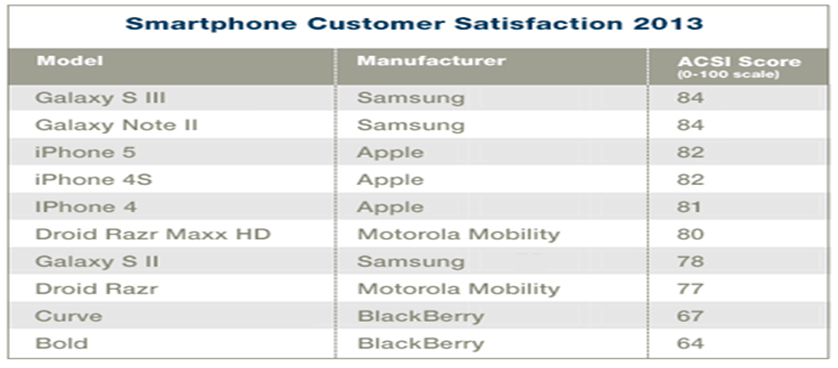
In the new Smartphone Customer Satisfaction Survey from the American Customer Satisfaction Index (ACSI), Samsung has beaten Apple. The Galaxy S III and Note II were above the iPhone 5 and 4S. The new study provides 2013 customer satisfaction benchmarks for 10 of the past year’s top-selling smartphone models in the United States.
The S III has an ACSI score of 84, as well as the Note II, while Apple’s iPhone 4S and 5 have only 82. The Galaxy S4 was not included because it hadn’t been launched yet at the time.
Although the US customers have rated Samsung’s smartphones higher than Apple’s, the Korean consumers still prefer Apple. According to the National Customer Satisfaction Index (NCSI) in South Korea, which uses the same technology as ACSI, the iPhone 5 has topped the Galaxy S III.
According to ACSI Director, David Amburg, “The latest earnings report from Apple was better than expected, but the name of the game for Apple has always been innovation. Samsung, on the other hand, shows a strong upward ACSI trend from the Galaxy S II to the Galaxy S III. If the S4 performs as well—or even better—in the eyes of customers, Samsung could threaten Apple’s dominance in overall customer satisfaction.”
About ACSI
The American Customer Satisfaction Index, the only independent national benchmark of customer satisfaction, is a national economic indicator of customer evaluations of the quality of products and services available to household consumers in the United States. It is updated quarterly, serving as a key macroeconomic indicator of the nation’s economy health, as well as a tool for gauging the competitiveness of individual firms and predicting future profitability.
ACSI uses data from interviews with nearly 70,000 customers every year. It benchmarks customer satisfaction for 10 economic sectors, 43 industries, more than 230 companies and over 100 federal or local government services. The reports scores are based on a scale of 0 to 100.
The ACSI’s time-tested, scientific model provides key insights across the entire customer experience. The ACSI’s benchmark results are strongly related to a number of essential indicators of micro and macroeconomic performance. At micro level, companies that display high levels of customer satisfaction tend to have higher earnings and stock returns relative to competitors. At macro level, customer satisfaction has been shown to be predictive of both consumer spending and gross domestic product growth.
The ACSI methodology has been adopted globally
The methodology of The American Customer Satisfaction Index (ACSI) has been adopted around the globe by research groups, quality associations, and universities via ACSI’s international licensing program called Global CSISM. Countries throughout Europe, Asia, South America, and the Middle East have created customer satisfaction indexes for their own national economies by using Global CSISM.
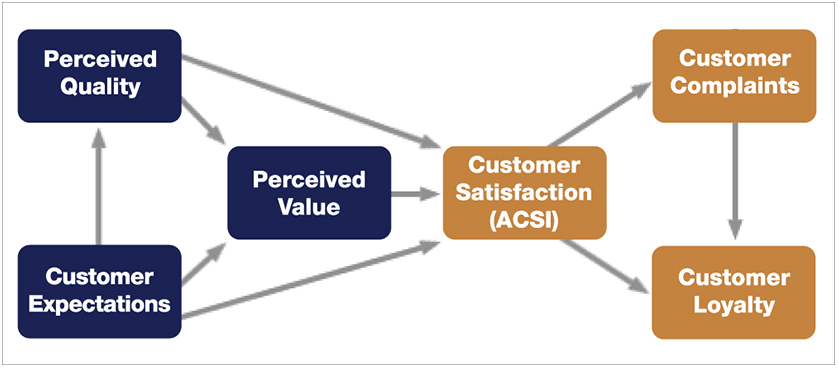
ACSI uses customer interviews as input to a multi-equation econometric model developed at the University of Michigan’s Ross School of Business. This model embeds customer satisfaction within a series of cause-and-effect relationships: indices for the drivers of customer satisfaction are on the left side (customer expectations, perceived quality, and perceived value), customer satisfaction (ACSI) is in the middle, and the outcomes of customer satisfaction are on the right side (customer complaints and customer loyalty, including customer retention and price tolerance).
The indices (shown in the diagram) are multivariable components measured by several questions. They assess customer evaluations regarding the determinants of each index; indices are reported on a scale of 0 to 100. The survey and modeling methodology quantifies the strength of the effect of the index on the left to the one to which the arrow points on the right. These arrows represent “impacts.” The ACSI model is self-weighting to maximize the explanation of customer satisfaction (ACSI) on customer loyalty. Looking at the indices and impacts, users can determine which drivers of satisfaction, if improved, would have the most effect on customer loyalty.
References:
Image source:

Tags: Performance in USA, Technology