Today’s competitive corporate environment recognizes that employees are their most significant asset. Thus, onboarding new hires is vital to their performance and success. Employee onboarding is a strategic investment that prepares employees for long-term development and productivity. According to SHRM, 69% of workers are more likely to remain in a company for more than three years if that company has a robust onboarding procedure. The significance of effective onboarding and its impact on long-term performance will be emphasized in three important pillars throughout the article.
First pillar: communicating vision and mission
According to HBR, 90% of employees are willing to work for less money in exchange for meaningful work. Consequently, it is vital to adequately communicate the organization’s mission and vision to new employees during the onboarding process. Employees may attain a sense of purpose and tie their work to larger business goals by integrating their expertise with the company’s values. This shared sense of purpose fosters a strong work culture built on a common goal. Google, for example, ensures that new workers learn and accept the company’s ideals via its “Ten Things We Know to Be True” onboarding process, resulting in the company being widely and consistently regarded as one of the best places to work at year after year.
Second pillar: providing on-the-job training and required tools
Image Source: Campaign Creators | Unsplash
One critical component of the onboarding process is ensuring that new hires have the on-the-job information and tools they need to succeed, especially in the wake of global digitalization and the tendency to opt for online job training. Starting new employees with the correct tools and knowledge positions them for success and improves their performance. Unfortunately, 59% of the employees claim that they didn’t have proper on-the-job training. This should be rectified since training programs that target particular work needs and equip individuals with the appropriate skills and knowledge result in fewer errors, more accuracy, and better performance results.
Third pillar: building employee engagement
Image Source: Yan Krukau | Pexels
The new hire onboarding process is also important in building strong networks within the organization. Companies may develop a sense of belonging by encouraging interactions and team building, which has a direct impact on employee performance. According to the HBR poll, just 25% of respondents believe they are highly engaged in their firms. Addressing such issues throughout the onboarding process helps new employees feel valued, integrated, and motivated to accomplish their best.
Many corporations launched a “buddy program” to implement an employee engagement strategy from the first day of hiring. A buddy assists a new employee throughout the first several months, explains processes, and gets them acquainted with the culture. This will increase corporate profitability since Gallup research reveals that highly engaged units are 23% more profitable compared to other less engaged units.
To summarize, recognizing employees as valuable assets and investing in their onboarding process is critical for long-term corporate performance and success. Organizations may improve new recruit performance and contribute to a healthy work culture that supports overall productivity and profitability by successfully communicating their vision and goals, delivering thorough on-the-job training, and cultivating employee engagement.
The Balanced Scorecard is one of the most important performance management tools used to improve business functions and their outcomes. This tool is used not only at the organizational level but also at the departmental level.
By using departmental scorecards, managers are able to get detailed insights into the performance of their departments. The scorecards can also determine the responsibilities of the employees in terms of achieving strategic objectives.
To implement an effective balanced scorecard for the departmental level, organizations should take into consideration these best practices.
1. Develop the right template.
Employees are often asked to collect data since every manager knows that it is essential in generating qualitative insights. However, the different performance reports could easily lead to different interpretations. A well-designed template leads to a clear, structured reporting and improves communication through standardization.
The template should contain four perspectives that meet the organization’s strategic needs. The most commonly used perspectives are Financial, Customer, Internal Processes, People Learning, and Growth.
Moreover, the template should also display the objectives associated with each perspective and the KPIs associated with each objective. For each KPI, the target and thresholds, the trend, and the previous and current result should also be presented.
2. Choose the right objectives.
When preparing a departmental scorecard, one of the most important steps is to select the right objectives for the different categories, and those objectives should align with the organizational and departmental strategy. Through the cascading process, the organizational objectives and KPIs are translated from the strategic level down to the departmental level.
The departmental scorecard must contain some specific objectives depending on the activities of the operations team. The same objective can be cascaded to more departments, each of them measuring it through different KPIs. Some organizational objectives may not be cascaded to lower levels.
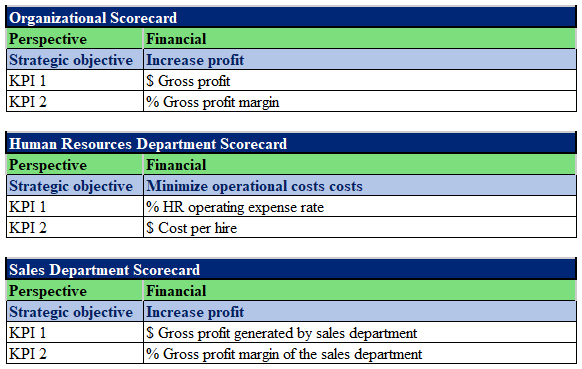
For example, the objective of the Financial perspective is to Increase profit. This organizational objective can not be directly cascaded to the human resources department since the human resources department has no direct influence on the revenue of the organization. However, they could reduce their spending in order to increase organizational profit. Therefore, the objective for the human resources department could be to minimize operational costs. Since the sales department is responsible for profit generation, they can cascade down this organizational objective without any modification.
Figure 1: Objective cascading example
3. Choose the right KPIs to measure the objectives.
As mentioned before, it is recommended not to cascade all objectives and KPIs from the organizational level to the departmental level, but organizations may add specific ones that represent the department. The most important attributes in KPI selection are relevance, clarity, and balance.
In many cases, organizational and departmental scorecards may not be enough to communicate the organizational strategy to all employees. Therefore, individual scorecards should also be created for them.
Data sources for a scorecard
During the scorecard development process, organizations may find it hard to determine the right objectives and KPIs. Objectives and KPIs must be based on relevant data. There are two types of sources of data to consider: primary and secondary.
Feedback from internal stakeholders can be considered as an internal primary data source, while feedback from external stakeholders is an external primary data source. Secondary internal sources could a company’s previous reports and strategy plans, while smartkpis.com and academic articles are external secondary sources.
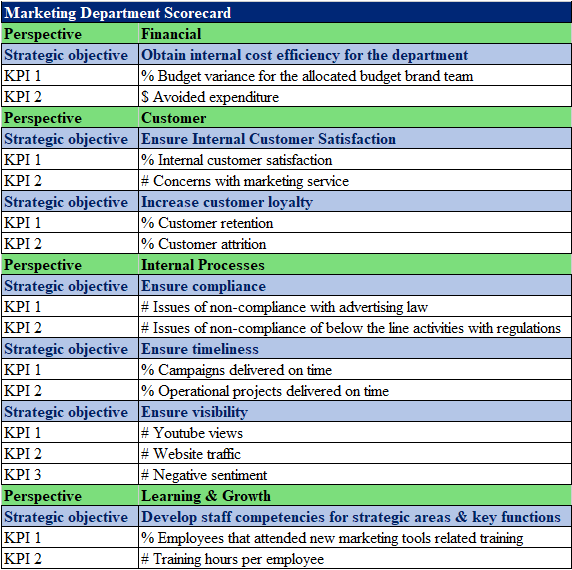
Figure 2: An example of a marketing departmental scorecard
High quality data can play a huge role in increasing efficiency and improving performance and can help managers in the decision-making process. Sometimes, it is acceptable to make decisions based on instincts and gut-feelings, but the majority of them should be backed up by numbers and facts.
Data-driven decision-making is a process of collecting measurable data, based on organizational goals, extracting, and formatting data, analyzing the insights extracted from it, and using them to develop new initiatives. Nowadays, advanced software is available to help with data gathering, processing, reporting, and visualizing, to support managers.
The main steps of the decision-making process
The first step to build a well-functioning, data-driven decision-making process is to clearly define organizational goals, and to identify the questions to which the answers we find can help reach these goals. For example, if our company’s revenue goal is to increase its portion of the market share by 20% until the end of the year, a good question would be: what are the most important factors which have influence on market share?
The next step is to identify data sources and to find custodians. The source of the data highly depends on its type. There are qualitative data, which cannot be expressed by numbers, and quantitative data, which can be measured by numbers. We can collect data from primary and secondary sources. Primary sources can be observations, interviews and surveys, whilst secondary data can be collected from external documents, third-party surveys and reports.
The third main step is to clean the gathered data. During the data cleaning process, raw data is prepared for analysis by correcting incorrect, irrelevant or incomplete data. There are six data quality dimensions which should be kept in mind, during this process: Accuracy (indicates the extent to which data reflects the real world object), Completeness (refers to whether all available data is present), Consistency (refers to providing the same data, for the same object, even if this data appears in different reports), Conformity (consists in ensuring that data follows a standard format, such as YYYY/MM/DD), Timeliness (indicates whether the data was submitted in due time, respecting the data gathering deadline) and Uniqueness (points out that there should be no data duplicates reported).
Only now, the data analysis process can start. Statistical models should be used to test data and find answers to the business questions identified beforehand. Descriptive statistics can help to quantitatively describe and summarize features of data and to describe, show or summarize data in a meaningful way. For example, monthly sales or changes in employee competency levels can easily be presented in a visual manner.
Interferential statistics can help find correlations between different variables and predict future outcomes. For example, by using regression analysis, we can make a prediction on how growth, experienced in the employee competency level, can positively affect the sales volume.
Even if the data gathered is cleaned and correct, and the data analysis process has respected all the recommendations above, if the data is not presented in a meaningful way, it will not be of much use. Well-presented information and the outcomes of the analysis can help in interpreting data, thus supporting the decision-making process.
From time to time, data should be updated and re-evaluated, to make the best decisions in today’s continuously changing business environment.
Conclusions
The advanced analysis techniques and software, which are available nowadays for the majority of organizations, make it possible to build up a data-driven decision-making culture, which leads to more prudent business decisions. These tools generate more thoughtful decisions that help performance improvement, which ultimately lead to organizational growth.
“Sector-led improvement is gaining momentum. Councils are investing in political leadership; finding new ways of engaging local people and communities; inviting challenge from peers; sharing good practice and utilizing comparative data as a driver for improvement.” Councilor Peter Fleming, Chairman of the LGA Improvement Board