In the search for best practices in the industry, companies need to look after some key aspects that can lead them to achieving superior performance. The benchmarking methodological uniqueness refers to the identification of business processes that can lead an organization to a superior performance, followed by the analysis of the best practices behind that success.
On the road to developing a strategic plan destined to determine and improve either the general performance of an organization or performance within a particular department, specific tools have proved themselves to be very useful for assessing the current situation and taking the next logical steps towards achieving the objectives set. One of the most used and most useful tools, when properly applied, is data analysis, due to the clear and precise insights an organization can gain from it.
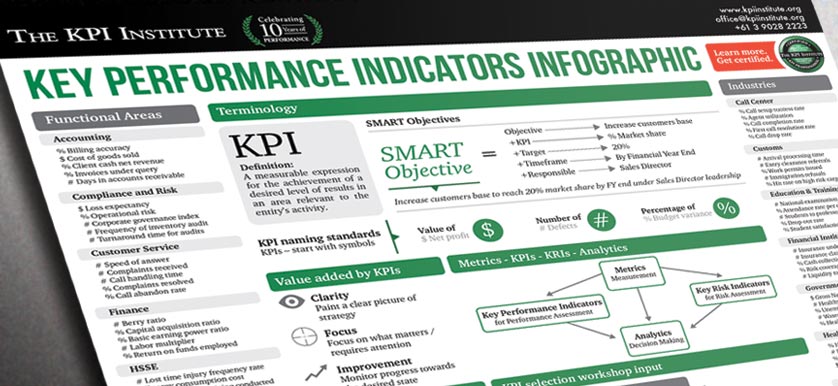
In the multitude of Performance Management tools available to be deployed across organizations, managers can become confused, while trying to identify what tools to use, when and how.
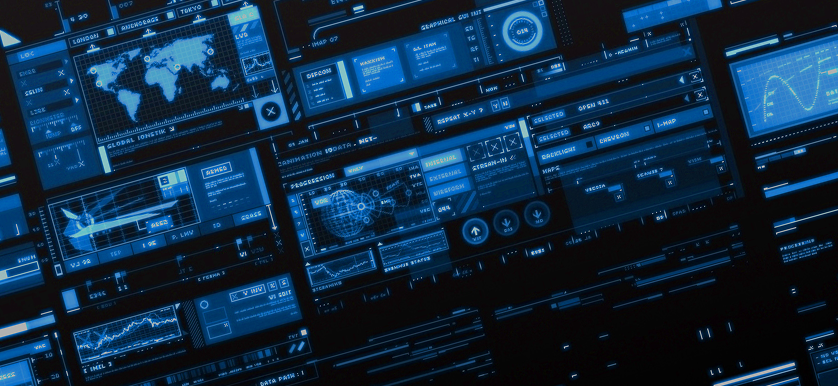
Humans are highly visual creatures. This allows for a higher understanding of data and enables managers, for example, to make quicker, smarter decisions. Looking back thousands of years, cavemen used visuals to, for instance, track time, record celebrations and other such activities.
Designing an individual graph may prove difficult to a certain extent. The degree of difficulty increases considerably when faced with the challenge of designing a dashboard. This is because a dashboard combines a large collection of information, often dissimilar, which can easily become cluttered.