What is Value Flow Analysis (VFA)?
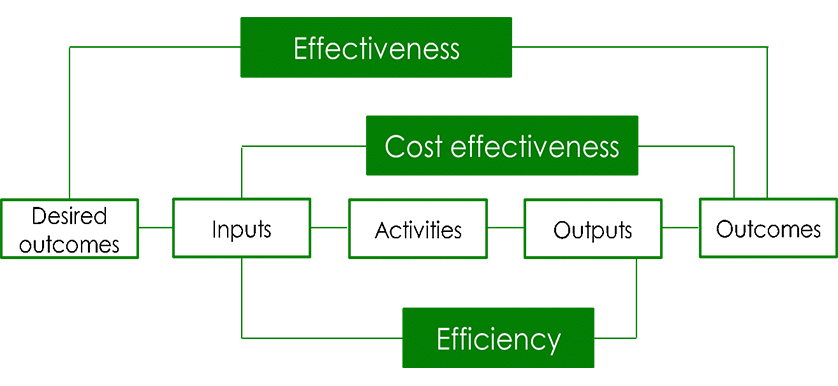
The Value Flow Analysis (VFA) represents a Key Performance Indicators (KPIs) selection technique, focused on analyzing the value generated by a system at all stages: Input, Process, Output and Outcome. This technique is mostly used during the KPI selection workshop, in order to properly measure the value generated within each stage. For each objective, KPIs are selected for Input, Process, Output and Outcome. Based on this initial listing, the KPIs that best reflect the achievement of the objective are selected.
- Input metrics are used to measure the quantity / quality of the resources provided for specific projects / activities. They usually reflect the budgets and human resource allocated, as well as the assets used.
- Process metrics reflect the transformations that take place with the inputs provided, in order to obtain the desired outputs. At this stage, time, utilization and availability are the key areas under surveillance.
- Output metrics indicate the results obtained, usually goods or services, through the use of inputs.
- Outcome metrics are used to measure the impact of employing the goods and services (outputs) previously obtained.
The benefit of grouping KPIs within each value generation stage is that it provides a better understanding of the actual process that takes place in order to achieve the selected objective, and its specific phases that need to be followed. Furthermore, it offers clarity around how to achieve effectiveness and efficiency. Outcomes are compared to the desired results, thus providing the effectiveness side, while outputs are linked to the inputs used, reflecting efficiency. It is not enough to obtain the results wanted. The challenge is to achieve them with a minimum use of resources.
For a better understanding of this technique, let’s take the following example: the Health Ministry sets as an objective for 2015 to lower the mortality rate in the state. The metrics assigned for each stage will be:
- Input: $ Budget, # Doctors;
- Process: % On-time delivery of vaccination programs;
- Outputs: # Citizens vaccinated;
- Outcome: % Mortality rate, % Incidence of disease.
As we can see, money and human resources were invested to make sure vaccinations will be delivered on time to the population. As a result, a certain number of citizens were vaccinated, representing the output of the vaccination process. Finally, the outcome measures the extent to which the objective was achieved. Thus, the fact that citizens were vaccinated does not reflect whether they are healthier or not. To measure that, we have to check if the incidence of disease decreased and the mortality rates lowered. Only at that point, we can measure the extent to which the objective set was achieved.
The VFA technique is a one of the most useful approaches of identifying the most suitable KPIs for the established objectives. It is one of the most effective techniques used during KPI selection workshops, as it provides users a proper understanding of the selection process.
References:
Image source:
- Adapted from Australian National Audit Office (1998), Better practice principles for performance information

Tags: Ask the Experts, KPI, KPI Selection