Performing well in the fight against criminality: the Mayor’s Office for Policing And Crime

The Mayor’s Office for Policing And Crime (MOPAC) from London, UK, is the strategic authority that coordinates the Metropolitan Police Service (MPS), making sure that the London Police operates efficiently and effectively.
In the “Police and Crime Plan 2013-2016”, MOPAC set targets for the MPS, in order to improve the way it manages its operations. The so-called 20:20:20 Policing and Criminal Justice Challenges refer to KPIs monitored against established targets, meant to be achieved by 2016. These indicators include: # Neighborhood crimes, $ Costs, % Confidence in the police, # Delays in the criminal justice system, % Compliance with community sentences and % Young people leaving custody reoffending rate.
For all of the above KPIs, the objective was a reduction or an increase, depending on the KPI’s trend, with 20%. For instance, it is desired less of crimes and costs, and more of confidence in what the police is doing.
To make the KPIs’ reporting efficient and transparent in the same time, MPS uses interactive Dashboards, available on its website, meant at showing citizens the progress towards achieving the desired results.
Crime, Criminal Justice Timeliness and Confidence Dashboards are available for further insights and analysis, with graphs and comments. For example, the Criminal Justice Timeliness Dashboard allows residents to review the progress against certain KPIs.
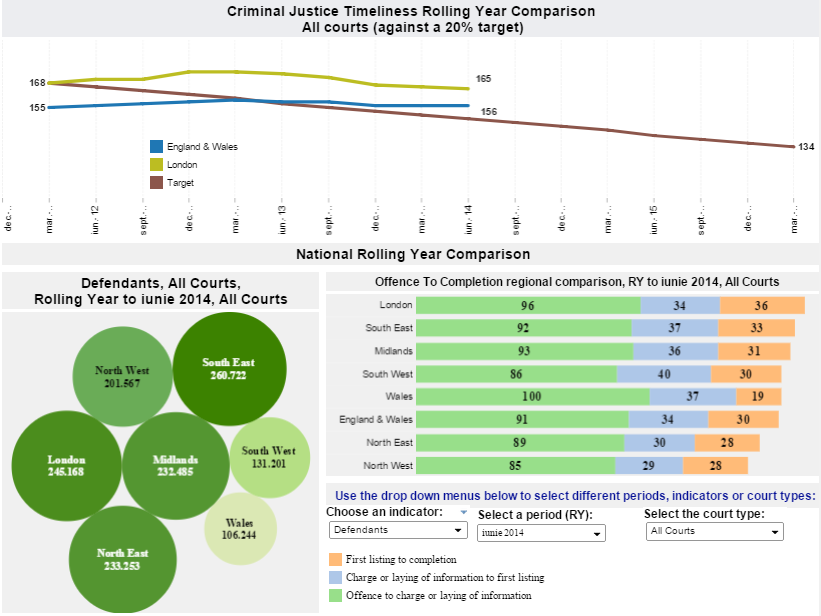
The Dashboard is highly interactive and provides access to important data. Several KPIs and time periods can be selected and graphs adapt accordingly. Also, results are provided for different regions, which allows comparisons and leads to sharing best practices. Five different tabs can be accessed: London vs National overview, Magistrates Court performance and comparison, Crown Court performance and comparison, each of them providing in depth information about the KPIs presented.
Another characteristic of this Dashboard is the variety of the graphs employed, as each type of data is presented with the use of a different graph. It is important to note the use of line graphs to show the trend in time and the bubble graph, used to present numbers by the bubble’s dimensions. Also, colors are used across graphs to better spot data.
The entire Dashboard is dedicated to checking the MPS progress in terms of cases being brought to court and time between an offence being committed and the case concluding in court. For the latter KPI, the 2011/12 result was 168 days, and the target for 2016 is 134 days, which means a 20% reduction.
All these efforts are meant at providing residents with more visibility around the MPS operations, this being the first time such an amount of data is being brought together, from the entire criminal justice system. The MPS objective is to assure residents they can trust the police, because the public authority does everything it can to keep them safe and protected.
References:
- Mayor’s Office for Policing And Crime (2013), Police and crime plan 2013-2016
- Mayor’s Office for Policing And Crime (n.d.), About MOPAC
- Mayor’s Office for Policing And Crime (2014), Criminal justice timeliness
Image sources: