KPIs. How many types are there?
Nowadays, key performance indicators (KPIs) are common management tools that enable managers to better understand their business and improve performance. Although their terminology may vary from one company to another (performance indicators, performance measures or KPIs), in essence all these terms have the same meaning. According to The KPI Institute, a key performance indicator is a measurable expression for the achievement of a desired level of results in an area relevant to the evaluated entity’s activity.
The field of performance management is a relatively new area, where tools and techniques may not be very well structured and terminology is sometimes ambiguous. Bringing more clarity in regards to key concepts can reveal a more efficient way of using KPIs.
Selecting KPIs is an important step in the process of measuring performance. In order to ensure the right KPIs are chosen for each objective, managers should have a wide understanding on what KPIs are. KPI typologies present various ways to look at performance indicators and create logical clusters. Grouping KPIs on specific criteria provides more clarity in regards to what is measured in relation to the objective assigned.
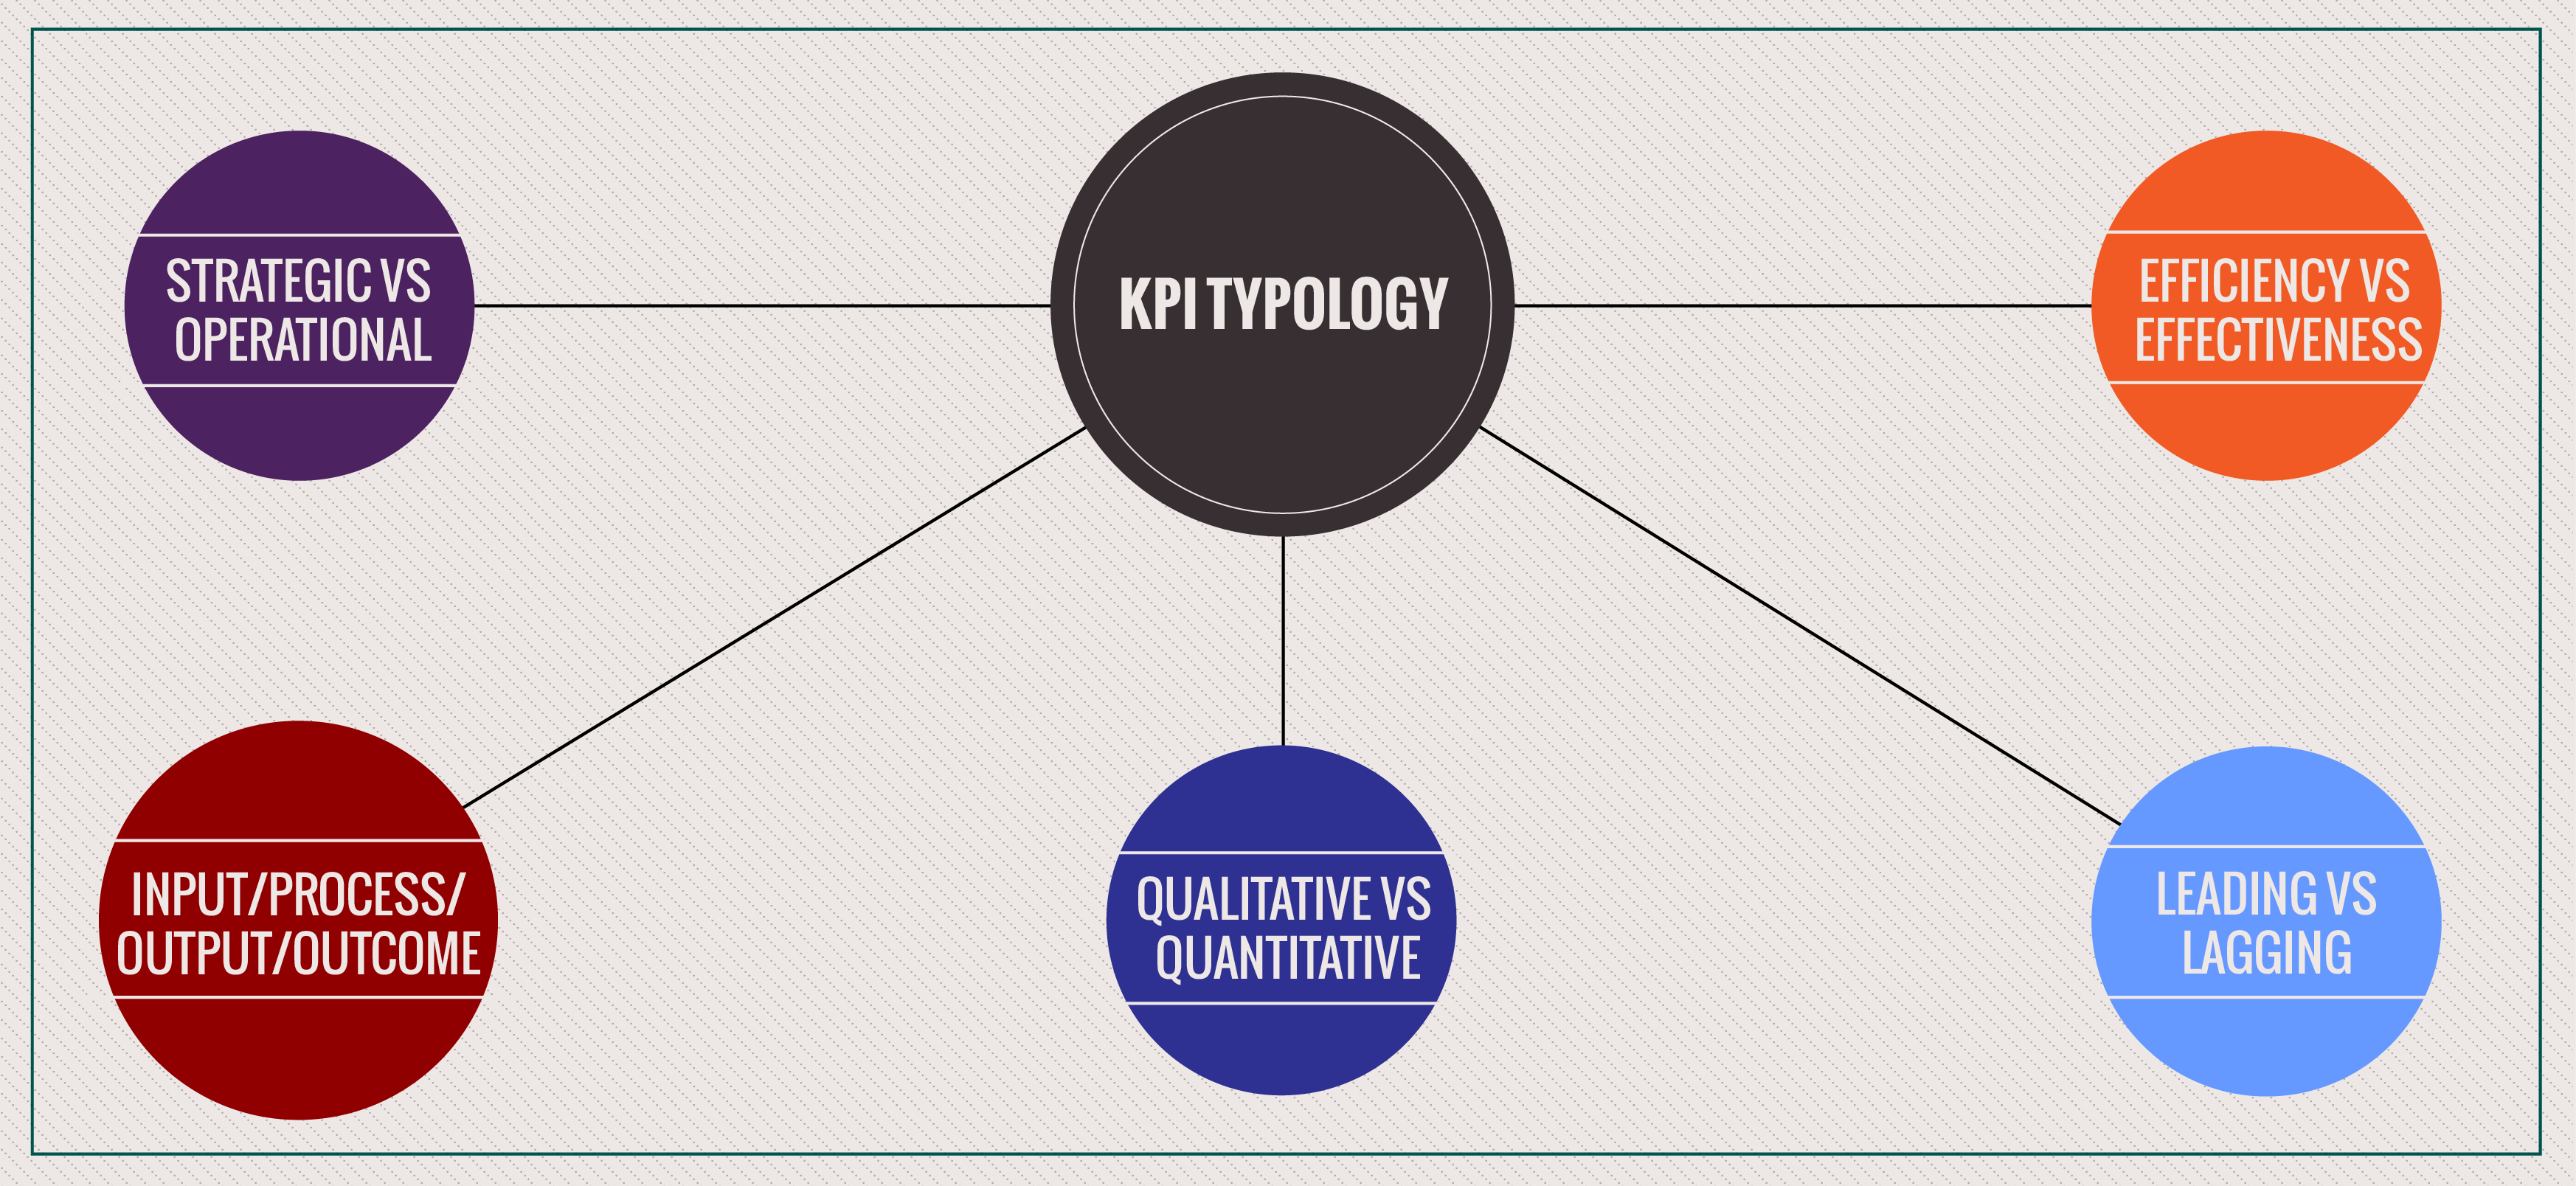
Some of the most common KPI typologies are:
Qualitative vs quantitative – this is probably one of the most popular approach to defining KPIs. Usually, KPIs that measure personal traits and perceptions are considered qualitative, while the rest are quantitative. In practice, it all comes down to quantitative data when measuring a KPI, even if this data reflects qualitative aspects, such as opinions.
Examples:
- Qualitative: # Customer satisfaction index, # International corruption index, # Service quality rating;
- Quantitative: # Transactions processed per hour, % Orders delivered on time, # Production cycle time.
Leading vs lagging – this typology looks at the interdependencies between KPIs. In this situation, distinguishing between a leading and a lagging KPI depends on the context. “Leading” refers to those KPIs that can influence future value, while “lagging” includes KPIs that indicate past performance.
Example: $ Profit can be a leading KPI for $ Training budget, but in a different context it can be lagging for % Processes optimized.
Efficiency vs effectiveness – these categories are useful in understanding important dimensions of a process. The effectiveness looks at whether the desired outputs were generated, while the efficiency indicates the extent to which time, effort or cost are well used for the desired outputs.
Examples:
- Efficiency: $ Delivery cost per item, # Transactions processed per man, # Time to process orders;
- Effectiveness: # Items delivered, # Transactions processed, % Orders processed.
Input/process/output/outcome – deploying a value flow analysis for each objective provides more insights for measuring the KPI. Relevant KPIs can be identified for each of the 4 stages (input, process, output and outcome).
- Input KPIs measure the resources involved in achieving the objectives, whether they are related to time, human capital or costs: # Team members, $ Project budget;
- Process KPI indicate the activities required to produce the expected outcomes: # Time to process invoices, % Equipment utilization rate;
- Output KPIs refer to either the quality or the quantity of the goods or services created: # Items sold, # Electricity generated;
- Outcome KPIs measure the impact achieved through the provision of goods and services: % Market share, # Customer satisfaction.
This value flow analysis generates several KPIs that can be used to track the achievement of each objective. Based on the most important and cost effective aspects that can be measured, 2 or 3 KPIs can be selected as the most relevant to be included in the scorecard.
Strategic vs operational – clustering KPIs based on the organizational level that they impact on is highly dependent on the context. However, there are some popular KPIs that are usually recognized as strategic, such as % Market share, # Customer satisfaction index, % Profit margin, $ Revenues. Operational KPIs can be considered # Time to load a vehicle, % Perfect order rate, % Processes optimized or % Errors rate. However, any of these KPIs can become strategic if the company identifies it as an important value driver.
Other typologies, less common are: active vs inactive (the KPI is monitored or not), primary vs secondary (the KPI does or does not rely on another KPI to be calculated), public vs internal (the KPI is published for a wide audience or reported only within the organization), human vs technological (the KPI data is exposed to human error or system errors).
In practice, acknowledging the existence of KPI typologies provides insights on how KPIs behave in different context and what dimensions can be measured for the same objective. By considering these categories in the KPI selection process, organizations can also balance their measurement, by selecting KPIs from the aforementioned opposed categories – efficiency/effectiveness, leading/lagging, strategic/operational.
References:

Tags: KPI, Performance Measurement