Energy use in organizations
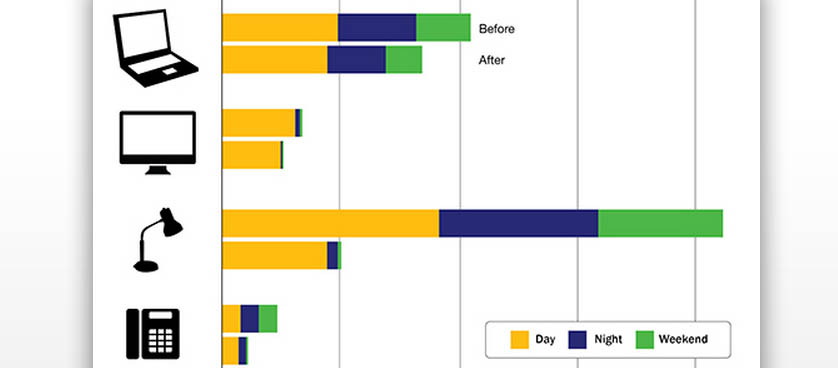
More and more, organizations are increasing the focus on the environment, in the idea of reducing their footprint and protecting the climate. A team from Carnegie Mellon University’s School of Architecture has designed a dashboard to monitor how much energy employees use at work. This tool tracks the plug load, meaning the total electronic devices that are plugged into outlets. This allows real time visibility of the amount of energy used daily.
In this way, employees are more aware of their impact on the environment, being more prone to reduce the level of energy consumption. Usually, the personnel is not very interested in conserving energy at work, as they do not have to pay the bills. However, employees need to be motivated to act at work as they do at home, having an economical behavior. Such a behavior can be achieved with rewards / penalties, but the proper way of doing things is to make the personnel understand the consequences of their actions.
Visual tools can help in this effort to raise awareness and dashboards seem to be efficient in this matter. A test was conducted on 80 employees, who were divided into 4 groups, in order to measures the effectiveness of using a dashboard to track the amount of energy used, and as a result, to take actions, and reduce it.
The first group, so called control group, was just monitored. It had no dashboard attached to track the energy consumption level. The second group was able to see their energy usage on the dashboard, but had no online control ability. The third group was able both to visualize its results and to control them online, while the fourth group had the option of monitoring the energy consumption, of controlling it online and of using the work schedule to control unnecessary plug loads.
After six weeks, the results were the following: the group with no dashboard managed to save 3.6% energy, mainly because of the increased awareness. The second group, which had information, but no online control saved 9%. The third group managed to save 20.2%, while the fourth one averaged 35.4% savings in their plug load energy consumption in the workplace.
Such results demonstrate the impact of using dashboards and support the efforts of reducing energy usage. Each department should deploy an energy dashboard within the organization, thus contributing to diminishing the environmental impact.
Examples of Key Performance Indicators that can be used to track performance in this area, include: # Energy consumption, # Electricity consumption per employee, % Energy produced from renewable sources and % Corporate data efficiency (CDE).
References:
- Wigley, P. and Bard, M. (2104), Carnegie Mellon researchers develop dashboard to help reduce energy use in office buildings
- The KPI Institute (2014), Environment KPIs
Image source:

Tags: Dashboard, Electricity performance, Performance in USA
Related Posts
 Performance dashboards in the public sector – Borough of Franklin Lakes, New Jersey
 San Diego – Regional Quality of Life Dashboard
 KPIs and Dashboards in practice: TrackDC an innovative District of Columbia Performance Management initiative
 KPI data visualization: key benefits, popular formats, and design principles
