The world is moving towards a more sustainable business practice. Investors, advocacy groups, and academics have asked corporations to take on added purpose beyond the traditional pursuit of shareholder value. Even the business leaders from Business Roundtable stated that major companies are investing in their employees and communities because they realize it is the only way to achieve long-term success.
The fundamental concept behind this shift is the Triple Bottom Line (TBL), where companies must measure not only their financial performance but also their environmental and societal performance as well. The TBL concept is not new; the term had been coined by John Elkington in the 1990s. Later in 2003, Amanco pioneered in measuring the impact of its TBL strategy, building on the idea of Balanced Scorecard (BSC) from Kaplan and Norton. The new sustainability BSC included environmental and social dimensions in addition to the basic dimensions of the initial BSC.
In a recent article, Kaplan stated that the demands for sustainability today are even higher. In summary, there are three different perspectives from three main stakeholders categories:
Customers: The customers’ preferences in every product category shifted towards more sustainable products. Over the past five years, there is a 71% rise in online searches for sustainable goods globally in countries with either developed or emerging economies.
Employee: Reports of unsafe working conditions at Amazon warehouses caused many criticisms. Their employees protested for fair pay and COVID protection. This example reflects the importance of social and ethical issues. Fulfilled workers are more loyal and likely to stay compared to those who only work for a weekly paycheck. Worse, incidents like this would probably affect consumers’ perception badly and hurt the company’s brand image.
Environment and social: As more consumers demand transparency and accountability, companies must consider the environmental and social aspects in every decision they make. For example, major fashion brands are beginning to pay attention to the demand for more sustainable practices.
The stakeholders have always played an important role in the business ecosystem. But in today’s post-pandemic era, the stakeholders expect even more from companies in terms of environment (e.g., sustainability, health) and social (e.g., inclusive, ethics, social welfare) aspects. As with any crisis, there are chances to learn and make a positive difference.
This article aims to remind companies of the criticality of environment and social dimensions. Taking note of its importance, this might be the opportunity to revisit the idea of sustainability BSC. The sustainability BSC can be used as a groundwork for a future BSC that is environmentally, socially, and ethically responsible. For more on utilizing the Balanced Scorecard, The KPI Institute has developed the Certified Balanced Scorecard Management System Professional to help organizations maximize the tools’ potential.
Employer branding is a long-term strategy focused on managing the awareness and perceptions of employees, prospective employees, and stakeholders relating to corporate identity and reputation. The process of internalizing employer branding encourages individuals to accept external values and show authentic attitudes.
Internalization occurs when an employee feels that they share the same or similar values as what their employer branding projects. However, for such internalization to occur, leaders must consistently talk about their employer brand, act as a role model, and therefore, implement their employer brand through “walk the talk.”
Employees feel greater value congruence when messages are communicated through employer brand values and when they experience regular interaction with employer brands. Senior management behavior, which reflects the values of employer brands, can fulfill a vital role in increasing employee engagement through employees who internalize employer branding values.
In order to successfully increase employee engagement, employees need to internalize the company’s employer branding values as their own. Conformity between employee’s values and employer branding values is called employee brand fit. This concept is derived from the definition of person-organization fit.
Employees who consider their ethical values are in line with employer branding tend to feel a higher similarity and more engaged to the company. The compatibility of the employer brand and employees encourages the latter to develop an emotional attachment to the company. In addition, when employees believe that their values are consistent with the values of their companies’ employer branding, they feel more involved with the company’s vision and beliefs, and they are more likely to be emotionally connected to the company.
Measuring Employer Brand from the Inside
A study regarding internal employer branding reveals that the five main factors to consider when measuring employer branding from the inside are compensation & benefit, training & development, ethics & CSR, work-life balance and healthy work atmosphere.
Compensation and benefit
It reflects the attractive salary and competitive benefits offered by the organization to its employees. An effective compensation and benefits package helps a company to not only be competitive within the market but also to retain talent. You can use these KPIs to measure compensation and benefit:
# Salary competitiveness ratio
# Compensation market ratio
$ Healthcare expenses per current employee
% Target percentile
$ Internal equity
% Human capital Return on investment (ROI)
Training and development
It reflects the skill development and growth opportunities provided to the employees for their current as well as future job positions. Here are the KPI examples for you to measure training and development:
$ Training cost per employee
% Employee received personalized training
# Training hours per full time equivalent (FTE)
$ Training investment per full time equivalent (FTE)
% Training programs for newly introduced innovations
Ethics and CSR
It reflects the ethical and social concerns of the organization towards both its employees, in particular, and society, in general. While ethics includes variables like the attitude of the organization towards the employees and legal procedures, CSR is the effect that corporations have on society with the aim of identifying and engaging new customers. You can use these KPIs to measure ethics and CSR:
# Company ethics violation
% Implementation level for guiding principles
# Confidential information leaks
% CSR programs implemented
# Environmental abnormalities and complaints received
Work-life balance (WLB)
WLB is characterized by the equilibrium between a person’s personal and official life. Organizations these days are becoming cognizant of WLB issues and have started incorporating WLB strategies into their employer brand. Here are the KPI examples for you to measure work-life balance:
# Employee Engagement Index (EEI)
% Absenteeism
# Employee Net Provider Score (eNPS)
% Employee turnover
# Happiness Index
Healthy work atmosphere
It reflects a friendly and less-stress work atmosphere and the team spirit amongst employees. The work atmosphere of every organization is unique and can be used as an employee value proposition of the company to distinguish it from competing firms. You can use these KPIs to measure healthy work atmosphere:
# Reported accidents and incidents
# Average overtime hours per employee
% Employee perception on management commitment survey
# Gender ratio
# Female to male salary ratio
Conclusion
To date, many employer brand strategies are delivered as a talent attraction tool. While lots of strategies provide useful insights about the employer brand’s external conceptualization and measurement, it devotes scant attention to the employer brand attributes that are considered to be important by the existing employees of an organization. The most important thing is, what’s implemented inside your organization can greatly influence your employer brand on the outside. If you’re interested in other KPI examples, sign up to our largest KPI database.
A well-functioning KPI measurement framework is more important then ever. In the fast-changing post-COVID-19 environment, organizations without a well-designed performance management system are not able to collect data-driven and real-time feedback, which is more important than ever because organizations need to make quick decisions as they respond to new challenges.
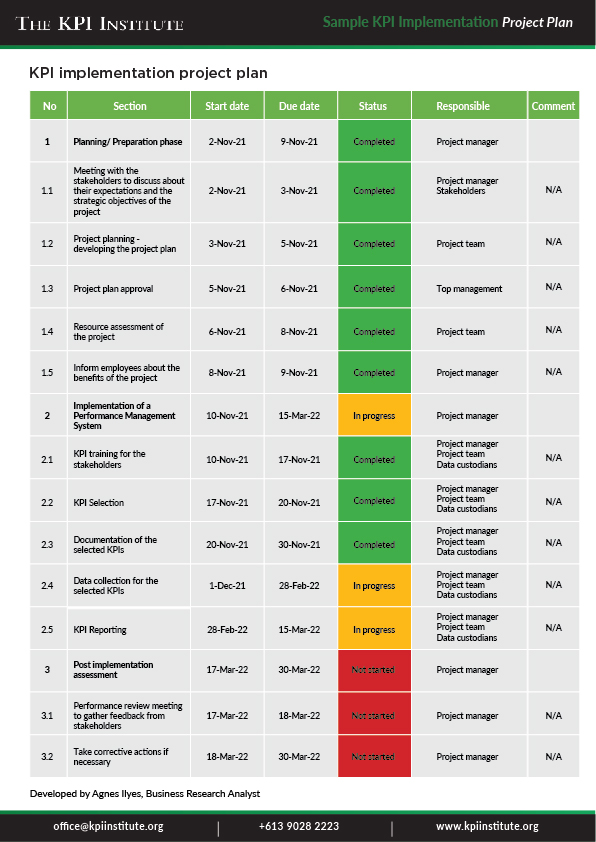
Organizations with no formal KPI measurement framework in place might consider implementing KPIs, and thisprocessstarts with a KPI implementation project plan.
The importance of a KPI implementation project plan
A KPI implementation project plan provides a structure for the implementation of an organization’s performance management system. Once the project plan is set, all types of activities would have a clear deadline and designated responsibilities.
Because a KPI implementation plan lays out all pertinent details, it promotes effective communication among the stakeholders of the project and reduces the impact of the project implementation gaps. Some of these gaps are the lack of buy-in from key stakeholders, unrealistic deliverables, and the inefficient assessment of organizational resources.
A good plan also serves as a compass for employees and other stakeholders in uncertain times because it guides stakeholders/employees towards reaching the strategic objectives of the organization.
Project planstages
The most common elements of a KPI implementation project plan are key activities, deadline, responsibility, status, and comments.
A KPI implementation project plan must be aligned to the organizational strategy and objectives. Before the implementation starts, a meeting with the stakeholders of the project should be organized to discuss their expectations and make sure that everybody is on the same page. After the plan is developed by the project team incoordination withthe project manager, the resource assessment of the project needs to be created. Then, another meeting withall employees is necessary in order to share the vision and benefits of such a project and delineatethe first tasks to be finalized.
The second phase is the actual implementation of the performance management system. Start with proper training for the stakeholders to establish a common languageand to avoid any misunderstanding. The appropriate KPIs should be selectedin a KPI selection workshop. Then, they should bedocumented using a pre-defined, standardized template. Moreover, the data should be gathered and reported by the data custodians. The report should be presented with good visuals that are easy to interpret. Thiswill help ensure a clear and effective decision-making process.
During the post implementation assessment phase, aperformance review meeting should be conducted to gather feedback from internal stakeholders and analyze the situation and the progress of the result. It is also important to evaluate the possible corrective actions to be addressed in the performance management system.
KPI implementation project plan example:
Conclusion
In order to arrive at the benefits of a well-functioning KPI management system, companies need to understand how to efficiently implement it and to ensure that all employees have a clear picture of the whole system.
Finding happiness and having a purpose in life is a goal of many people. However, the concept of happiness is so broad that people can’t even begin to understand where they should start to look for it. People start to define their version of happiness and what could make them happy. Having a family, a successful career, and a big house are among the things that most people often associate with happiness.
One of the most prominent aspects that are often associated with happiness is money or how much money people can make. One famous study from 2010 by Daniel Kahneman and Angus Deaton even tried to test this hypothesis by measuring people’s level of happiness with their income. They found that the more money people make, the more they tend to have an increase in emotional wellbeing. In other words, as someone’s income increases, their wellbeing also increases.
However, this effect stops at a certain point. Once people make about $75,000 a year, their wellbeing stops increasing altogether. This study answers some people’s earlier questions about how important money is to happiness and how they can achieve it by making $75,000 a year.
However, a newer study in 2021 by Matthew Killingsworth contradicted this research. They found that a higher income above $75,000 can still positively affect people’s happiness and wellbeing. In this study, they also measured wellbeing in greater detail by using real-time assessment in asking participants how they are feeling at the moment instead of how they felt in the previous week or month. The result was that they found higher earners felt great and happy.
So, does that mean that people with low income can’t ever be happy? Researchers argue that, although money does play an important role in people’s overall happiness and satisfaction of life, it is also only a modest determinant of happiness. There are many ways how money can contribute to people’s happiness.
Increased comfort
Although money is not everything, it is a means to have a comfortable life. When you have enough money, you can have all your basic needs fulfilled. Living in a comfortable house, eating healthy food, having access to health care, and feeling secure and safe are things that everyone needs. You won’t be able to think about happiness or enjoyment when you are feeling hungry or cold and have no home to go to.
This is in line with the NCHS data statistic that found people living in poverty were three times more likely to have depression. Another thing to highlight from Kahneman and Deaton’s research is that their participants are all American, so the living standard and income that they found is limited to them. An income of $75,00 a year might not be the threshold for everyone; it could vary, depending on the cost of living in a specific area and one’s interest.
As long as you have enough money to fulfill your basic needs, then you are halfway there. Having more money to buy things that you like can increase your positive emotions and comfort. You can also use the money to hire help to do your household chores so you can have more time to spend with your friends and family which is also important for your wellbeing.
Control in life
From Killingsworth’s research, they found that control in life plays a significant impact on their respondent’s level of happiness. People who have a higher income are happier, partly because they have an increased sense of control over life. Moreover, a sense of control accounted for a 74% correlation between income and wellbeing.
People that have more money can have more choices and options on how they want to live their life. For instance, having extra income can allow them to eventually afford a better housing arrangement or eat better meals. The more money one has, the more options become available to them.
However, it is also worth noting that making more money could also mean dealing with more pressure from work, leading to less time for socializing, and even lesser time for leisure and rest. So, the autonomy that you have by having more money might come with sacrificing other areas of your life. Therefore, you need to understand how much money is “enough” to avoid constantly chasing for more in exchange for the things that are more important in your life.
Value of money
How much money can bring you happiness also depends on how much value and meaning one puts into the amount of money one has. People who put a great emphasis on how money contributes to their happiness will feel happier when they have more money than people who don’t value money as much. A studyfound that for those living in rural areas, spending time with family, and having contact with nature are things that contributed to their level of happiness as opposed to those who live in a metropolis.
However, with increasing income that is commonly found in industrialized countries, social and economic factors have a bigger impact on people’s level of happiness. This finding suggests that people’s perspectives on the importance of money will affect how much money they need to bring them joy and happiness. In contrast, people who put less value on money are happy in a comfortable, safe, and strong community; they feel free to enjoy life regardless of how much money they are making.
Instead of focusing more on how you can make more money, try to understand what you think money will bring to your life. Having more money may help you gain certain things that will bring you happiness and other positive emotions. It is important to note that money can’t buy all of the things that will make you happy; in fact, you might find another way to attain certain types of happiness even without money.
Experience vs material goods
How you spend your money is also crucial on how it can affect your happiness. Some people spend their money on material or tangible things like bags and jewelry, while others spend more on experiences like going on vacation or attending a concert. A 2014 research found that experiential purchases bring greater happiness than material goods because they can effectively improve social relationships, form an important part of one’s identity, and lead to fewer social comparisons than material purchases.
Aside from that, a poll in 2014 also supports this research where they found that millennials prefer to spend their money on experiences than on material goods. However, this can’t be applied to anyone. For some people, material goods can bring them a lot of happiness if they have a very strong affinity for them. The main point is that spending money on experiences or material goods could increase wellbeing because it can fill one’s higher psychological needs like connectedness and a feeling of being alive.
Be it experience or material things, you need to understand why you feel they can bring you happiness. One does not better than the other because, in the end, it is still spending vs. spending. So, before you spend your money, ask yourself why you need a certain thing and what you can get from purchasing it.
Conclusion
A lot of evidence suggests that having more money will bring more happiness. However, money will not inevitably increase your happiness. The way you perceive, spend, and how much you value money will shape how much happiness you can get from it. How much money a person needs to be happy varies depending on how much to cover their basic needs and what can bring them joy without sacrificing other important aspects in one’s life such as time or rest. Whether it is a concert ticket or a new pair of shoes, ultimately money can increase your happiness if you spend it on experiences or items that are aligned with your values.
The internet has become the primary source of information for people around the world. According to a survey conducted by Pew Research Center, 53% of US adults rely on social media for news, with 36% depending on Facebook as a regular source. Meanwhile, YouTube comes in second place with 23%, followed by Twitter with 15%.
New social technologies have accelerated information sharing, providing easy access to huge amounts of information. Despite that, internet-based media is also characterized by unregulated information flow and the spread of deceiving, inaccurate, and uncheckable information.
Inaccurate and deceptive information is often manipulative and used to evoke suspicion, fear, worry, and anger. Misleading information, created with or without intent, is designed to be sensational and provoking with an aim to attract attention and profit off panic and fears. Research shows that false information tends to spread farther and faster; while fake news brings about emotions like fear and disgust, people are inclined to find false news more novel than factual news.
Misinformation is a widespread problem. However, psychological explanations of information processing can help avoid falling into the trap of misinformation and build mental resilience by embracing a more critical and skeptical approach. It is important because individual and societal wellbeing is related to having an accurate picture of social reality.
Let’s first acknowledge what contributes to the pervasiveness of misinformation on the internet-based media.
The problem with the internet-based media
Digital media has allowed individuals to be active in content production, leading to a wide range of personalities and opinions appearing on online platforms. One of its drawbacks is the absence of assurance regarding content quality and credibility.
Digital transformation of media platforms has enabled algorithms and automation to govern content recommendation and filtering of information. In other words, not every user on social media receives the same news feed. As such, the algorithmic selection of social media sourced news plays a role in the creation of an echo effect in which users encounter information that resonates with their opinions and beliefs.
The term echo chambers is coined to describe the exposure people have only to opinions that they agree with on social media. This is regardless of being true or false. In turn, their opinions and preferences are being amplified.
Cognitive biases of information processing
The accuracy of information found on social media platforms is often unclear. Additionally, echo chambers limit users’ ability to encounter content that might challenge their opinions. Due to these two factors, the responsibility to evaluate the information’s credibility and make decisions now falls on the user and their conscious efforts to do this task. However, perceived credibility is not free from one’s interpretations and preformed notions. How users select reliable sources of information and evaluate their credibility presents new challenges in internet-based media.
Cognitive processes are involved in making a judgment while cognitive biases determine what information is accepted or rejected. Cognitive biases and faulty reasoning in processing certain information can influence one’s decision-making. This may make information seekers vulnerable to misinformation.
Information processing is influenced by one’s preexisting beliefs which connect to confirmation bias as it plays a role in shaping information consumption patterns. Confirmation bias consists of three components: information search, evidence interpretation, and memory recall. These three components are often biased in support of one’s previously held beliefs, expectations, and preferences for information that complies with their attitudes and justifies their opinions.
People unconsciously may engage in biased search processes to seek out information that supports their preconceptions about a certain topic. Biased searching for supportive information may result in poor decision-making. Information that confirms and reinforces users’ preexisting beliefs may be interpreted as being more persuasive. Simply put, confirmation bias means actively seeking confirmatory evidence.
As a result, users may end up outweighing positive confirmatory evidence without questioning the credibility and even refute or ignore evidence if it challenges their beliefs. Confirmation bias may also become salient when people rely on their background knowledge and experiences in information processing.
Bias blind spot is another form of cognitive bias. It refers to recognizing biases that other people have in their judgments while believing that one is free from their own biases. If you are likely to detect the existence of biases in others more than in yourself, it might be a good idea to do some self-reflection first.
Conclusion
Neither echo chambers nor confirmation bias can be eliminated completely; however, through digital wellbeing skills, their impact can be managed. The use of social media as a source of information presents both benefits and challenges; whether it maximizes or diminishes an individual’s wellbeing benefits depends on the user’s media consumption and online behaviors. Checking one’s own cognitive biases is one way towards enhancing wellbeing. Being aware of confirmation bias and taking steps to perform a critical stance towards one’s preexisting beliefs and preconceptions can be achieved by performing critical thinking and learning how to learn.
Being conscious consumers of digital media is a way to manage challenges and optimize one’s wellbeing as a result of online behaviors. To better equip an individual from the negative impacts, developing digital wellbeing skills can help in controlling stress resulting from the overwhelming flow of (mis)information and communication overabundance. This is done by efficiently filtering one’s attention to focus on one’s personal goals and wellbeing.