From fashion design to annual report design: Inditex Group, the owner of Zara
Reporting performance has been associated for a long time with negative feelings, as both managers and employees have linked it with the consequences of not meeting targets. For some companies reporting performance is just a regulation imposed by financial authorities, while for others is a way of communicating and gaining trust of stakeholders.
An adequate approach towards compiling annual reports can transform a simple document into a really useful peformance management tool. Besides the presentation of performance results, the annual report should communicate the company’s strategy, its main capabilities, the challenges it has to face and the future directions. Financial KPIs should be balances with non-financial indicators as well as qualitative with quantitative aspects.
A positive example to learn from is Inditex Group, one of the largest fashion retailers in the world. The following initiatives are considered to be good practice in regards to consolidating annual reports:
1. Principles for guiding the drawing up of the annual report – Having a clear framework ensures consistency in time and better outcomes.
- Strategic sustainability context – Seeks to contribute to the improvement of trends, economic, environmental and social conditions at local, regional and global level.
- Materiality – Covers those indicators that reflect the organization’s most significant social, economic and environmental impact, as well as those that are of influence for the stakeholders’ decisions.
- Stakeholders inclusiveness – Maintains a constant dialogue with its stakeholders to respond to their expectations and interests.
- Completeness – Coverage of Inditex’s indicators and other important information must be sufficient to reflect significant social, economic and environmental impact and to enable stakeholders to evaluate the group’s performance for the year.
2. The Inditex website has been redesigned to allow better access to stakeholders to the content that concerns them.
3. The report includes information regarding all types of capital used to generate value and address challenges: human capital (the sum of capabilities , knowledge and experience of employees), intellectual capital (the result of R&D activities), financial capital, social and relationship capital (relationship with shareholders), manufactured capital (tangible assets resulted from its activities) and natural capital (environmental resources).
4. Clear framework for corporate governance – Mechanisms, institutional and operational bodies, and codes of conduct.
5. Materiality matrix – Is used to define the relevance of the aspects and issues Inditex handles with its stakeholders. The matrix is updated by the organisation each year and contributes to discover: the level of concern felt by the stakeholders towards aspects they consider of key importance, their current or potential impact on Inditex and the organisation’s responsiveness to these.
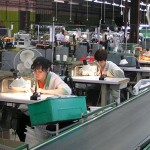
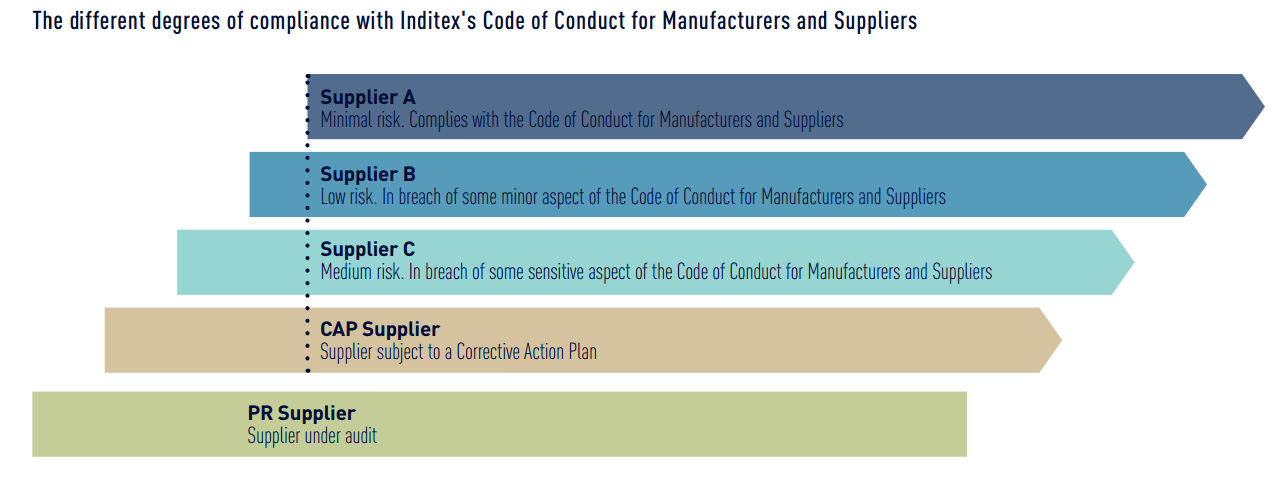
6. Tracking suppliers – Suppliers are classified according to their compliance to the Code of Conduct for Manufacturers and Suppliers.
7. Transparency and information as a core value for governance – Good Governance requires that stakeholders may have a regular and timely access to any relevant, appropriate and reliable information. All revelant information can be found on the company’s website, but also regulary annoncement about the company’s performance and initiatives.
8. Structured information – The challenges the company has to face are presented in the following manner:
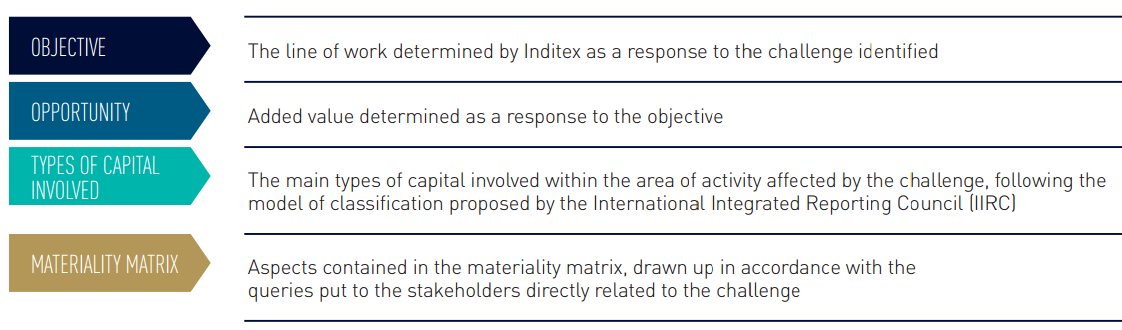
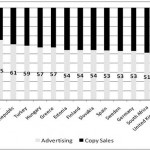
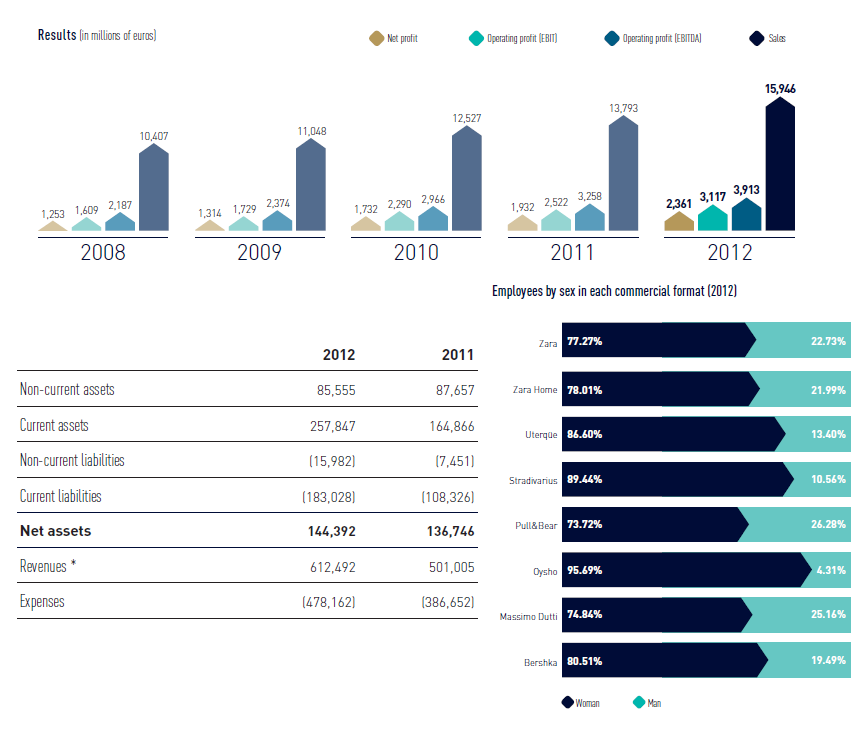
9. Efficient data visualization – There is a clean structure combined with high information density, bar-charts are properly use to enhance comparisons and they reflect the meaning of the data. Tables are easy to read and reflect aggregated data, key measures for stakeholders. Without distracting backgrounds and gridlines both charts and table facilitate fast and accurate absorption of information.
10. Simple, yet appealing design of report – The same color combination and shapes are used from the first to the last page of the document.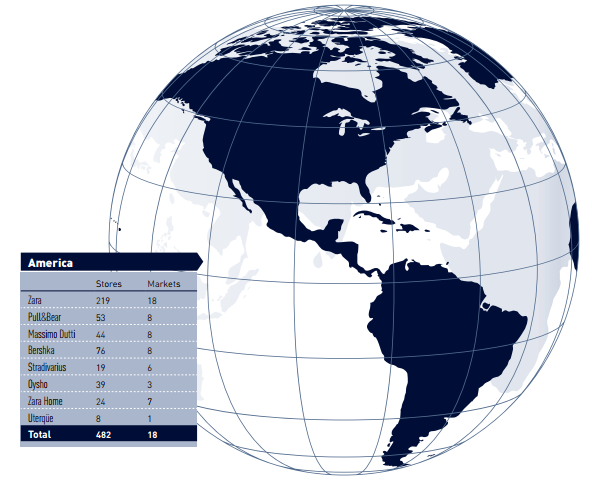
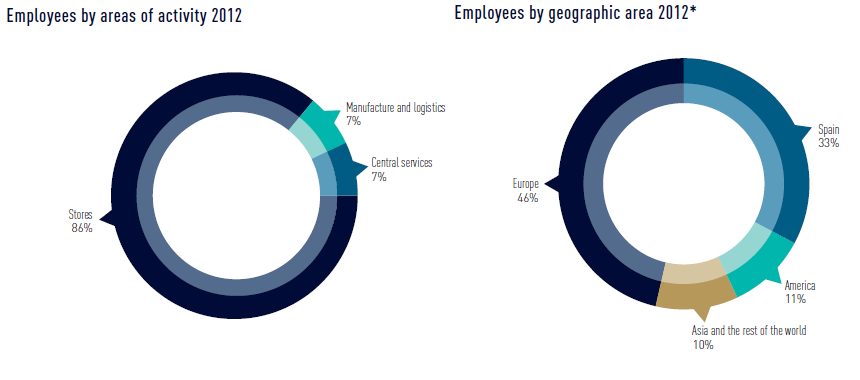
What can be improved?
- Ring charts are not recommended to visualize data, in spite their popularity. They occupy too much space and it is hard to estimate the values of each segment, causing confusion when reading the data. The alternative would be to use bar-charts.
- The timeline of tables is advisable to be from left to right in chronological order, in order to better grasp the evolution of KPIs from one year to another.
- Data from tables may be more easily to spot if it were displayed in charts or graphs.
References:
Image Source:

Tags: Fashion performance, Inditex, Performance Measurement, Report Analysis, Zara