There’s one at every workplace. That employee everyone describes as a “natural.”
“They just have it,” “They’re born for this,” “They’ve always been a high performer.”
The John XBox or Jane Hollywood of a company. Somehow, they never falter nor waver. When someone is landing everything perfectly, it’s natural to focus on an inherent quality like talent, intelligence, discipline, a strong work ethic, or an ineffable X factor the rest of us apparently weren’t born with. Just as it’s natural to attribute struggle to a lack of those qualities, such as “They’re just not cut out for the job” or “They don’t have what it takes.”
It sounds like it makes sense. Oftentimes, too much sense, and in this case, that is right on the money, for this is one of the most prevalent myths of performance management.
Talent exists, undeniably, but performance alone seldom comes close to telling the full story. Consider this – have you ever seen an incredibly strong performer jump teams and inexplicably become mediocre? Or someone who struggled under a manager excel under a different one? To go even further, maybe an entire department magically improved after the head of the department changed, yet all of the people in that department were the same?
Those kinds of scenarios simply shouldn’t happen if performance were just an inherent personality trait. Yet they do, and they happen in almost every single company there is.
Why?
Well, because performance doesn’t travel with employees inside their briefcases. It’s a consequence of continuous interplay between an individual and the ecosystem in which they work, and in this, too, too many companies get it wrong.
The Dangerous Habit of Labeling People as “High Performers”
We love our labels. We stick them on people as if they’re goods on a shelf:
High performer.
Low performer.
Top talent.
Underachiever.
They’re very handy mental shortcuts which allow us to compartmentalize humans into well-defined categories. The difficulty is that humans aren’t quite as easy to define as rows on a spreadsheet. To say someone is a high performer is to implicitly attribute performance to their stable characteristics, akin to eye color. However, performance isn’t a static characteristic but a dynamic and conditional one.
A software engineer who is performing wonderfully in a dynamic startup may be flailing in a large, monolithic organization where there are six layers of approval for any change.
A world-class salesperson may be a dismal failure when asked to sell a product they don’t believe in.
A competent project manager can completely underperform in an environment where they are constantly being micromanaged.
A highly creative designer may seem average in an organization that values strict adherence to templates over original thinking.
An experienced leader can look surprisingly ineffective when placed in a team that lacks trust and psychological safety, making honest communication impossible.
Did all of these people suddenly lose their abilities just like that? Were their skills Thanos-snapped?
Absolutely not, but their environments definitely were, and herein lies an extremely expensive error on the part of organizations: they consistently seek to fix underperformance by replacing people rather than fixing the environment people work in. Now, this is not to say that any person can be made to perform well in any job. Certain jobs will require certain interests or native abilities; therefore, hiring the right person still matters. With that said, once a person has been hired well, we are still very much left with the task of setting up the right environment to let them succeed. Now, these aspects are two very different issues.
Talent Matters, But Not in the Way We Usually Think
Perhaps one of the more thought-provoking differences comes from Gallup’s work in talent. According to them, talent is “any relatively natural pattern of thinking, feeling, or behaving.” Skills and knowledge can be developed or trained.
Often, we bundle it all together into one word: “talent”
Someone is great at giving speeches? “They’re talented.”
Someone effortlessly builds strong relationships wherever they go? “People person.”
Yet that doesn’t seem to answer the actual questions that arise regarding talented people:
What % of that is actually talent?
What % is built through years of experience?
What % is deliberate practice?
What % is confidence through success and repetition?
What % is working in the right kind of environment to allow those things to flourish?
When you begin to ask those questions, the cause of high performance is far less simplistic and turns out to be a multi-faceted phenomenon. Talent clearly affects potential, can make some tasks seem easier, speeds learning, allows faster progress compared to peers, etc, but potential isn’t performance. Potential still requires a certain amount of opportunity, environment, instruction, and practice to consistently lead to excellent performance.
Words Shape the Way We Manage People
Here’s an interesting tidbit: a 2023 study published in the Journal of Organizational Behavior and Human Decision Processes found that just labeling an attribute as “talent” rather than “skill” caused people to frame that attribute differently. Namely, when managers and HR personnel referred to a trait as talent, it seemed more fixed and less malleable. This made them more skeptical about whether an employee would improve over time and more prone to hire someone else than develop their existing employee.
Let us ponder these findings for a moment: if we believe top performance is largely something that you either have or you don’t, coaching feels futile, does it not? Training feels like an expense rather than an investment. Development feels like a nice-to-have, an optional extra. After all, why work with someone who “just doesn’t have it”?
This is little more than a small tweak to language, but a large tweak with significant effects on the management systems we build, and maybe that’s the problem with the “natural” performer story: not that it recognizes great performance, but that it silently suggests it cannot be built.
Employee Performance Is an Outcome, Not a Personality Trait
Here’s a thought experiment that feels relevant for our subject. Suppose two companies hire exactly the same employee: same background and education, same amount of experience, same personality profile, same motivation to succeed, and same range of abilities and aptitudes. For all intents and purposes, the employees feel the same. Six months later, one company believes he has leadership potential and expects a great deal more. The other company has already put him on a performance improvement plan.
So what has changed? What has led us to this particular conclusion? ➡️ The environment around the employee. ⬅️
This is not a hypothetical scenario either, since organizations experience it every day. Employees move to other companies, and suddenly they flounder, or flourish if the environment is right. A team that was failing under one leader suddenly soars under another. Organizations undergo reorganizations, and productivity simultaneously improves, or gets worse, when it’s pretty much the same set of people doing the same set of jobs. There would be no way to account for such phenomena if performance was wholly inherent in the individual. Once we recognize performance as a resulting variable, however, these phenomena become easily understandable. We are tempted to look for performance within the individual as though it were a stable attribute or personality characteristic. That’s not really how this works, since performance is more like the solution to an equation, while the individual is one element of the equation. An individual’s skills, knowledge, experience, and desire contribute an element that can be measured and can fluctuate or grow or shrink over time. The individual’s “potential” contributes an element, too, but the conditions within the environment contribute other elements.
Removing these external obstacles to performance, you can watch even ordinary people exceed all your expectations. Adding them, you can watch even outstanding individuals fail miserably. This is not to suggest that everyone can perform optimally in any role, nor that organizations are responsible for every failure of an individual’s performance. However, this mindset suggests that looking only at the individual rarely tells the full story. Unfortunately, that’s all many organizations bother with.
The Best Employees Don’t Just Work Hard: They Work in Better Conditions One of the most enduring myths about high-performing businesses is that they’re just full of talented people. Their hiring departments simply don’t miss. Somehow, they manage to fish the best possible recruits out of the entire hiring pool every single time, without fail.
Obviously, hiring is important; in many ways, it’s the most crucial decision a business can make. That’s where the similarities end, though, between all these companies.
Here’s a practical example: think of a Formula 1 racing team.
Even if they have the best driver in the world behind the wheel, that team isn’t winning races with a faulty engine, slow pit stop crew, worn-out tires, and an uncertain strategy. The fastest car alone won’t make an average driver a winner because performance arises from the interaction between the individual and the environment they work in.
Work in any company, SMEs or large corporations, is no different. An exceptional employee with uncertain goals, conflicting objectives, out-of-date processes, and frequent interruptions will not perform at their highest potential.
However, an employee who may not be as extraordinarily skilled could nonetheless excel when clarity of expectations, quick decisions, and mutual trust prevail. This also explains some of the misunderstandings surrounding high-performance teams: at first glance, these groups operate effortlessly; projects move quickly, people naturally collaborate, problems get sorted out before they snowball into full-blown crises. It is understandable, thus, to conclude that these teams are simply packed with more talented individuals than other groups.
In the majority of cases, this is simply not true. Rather, these groups have something else going for them: trust.
Information flows faster, errors are caught earlier, knowledge is shared, conflicts are resolved, and the team progresses quicker not due to rash behaviour, but rather because they spend less time questioning each other’s work.
Talent drives individual contributions, but trust determines the overall performance of those contributions as a team.
The Talent Trap: Why We Love Simple Explanations
Humans are great storytellers and even better simplifiers.
Does someone succeed? OH, they’re talented.
Does someone falter? Oh, they’re lazy.
Such bare-bones reasoning takes the pressure off of having to tackle more complex motives.
Yet simple stories don’t often describe how the workplace operates.
Meet Bill, an individual sales representative whose quarterly sales goals have started to consistently fall short. Now why is that? What is the real reason that Bill went from hero to zero?
Maybe it’s poor performance, but then again, the organization DID implement a new CRM and no one knows how to operate it.
Maybe it’s due to marketing changing their process for qualifying leads.
Maybe it’s a shift in pricing that made their products less competitive.
Maybe their sales territory was reconfigured, and that caused it.
Maybe they have a new manager.
Maybe the demands of their customers have changed.
Maybe it’s everything, everywhere, all at once.
Performance is often the outcome of numerous causes all working on each other simultaneously. Labeling a person as a good or bad employee can hardly ever capture a realistic, useful picture.
Research that Morten Hansen has conducted over several years examined the variables of individual employee performance and led to the same conclusions. He found that an individual’s performance has much more to do with how they perform – their habits, practices, and attitude toward the work – than with any other variable, like demographics, job tenure, or merely working more hours. This suggests performance is neither haphazard nor fixed; instead, performance is the result of countless decisions, many of which an organization is making all the time.
What Great Managers Understand That Others Don’t
One of the largest differentiating factors between average and high-performing managers is not necessarily the way they measure performance, but the way they conceptualize it. When an employee is performing poorly, average managers may jump to, “What’s wrong with this employee?” Great managers are likely to ask something else first: “What’s getting in the way of this employee performing well?”
One assumes that the problem lies in the employee, while the second assumes that there might be something to explore before concluding that. This “something else” could be capability, motivation, fit for the role, training, lack of clear expectations, the leader assigned to them, or any of a multitude of factors. It may be that someone is put in a position in which their talents rarely get a chance to make a difference. High-performing managers know that those other factors aren’t excuses; they are variables.
Ignoring them will never solve them.
In fact, if the purpose of performance management is indeed better performance (rather than simply better documentation), a manager would be wise to learn the impact of all the variables.
Stop Looking for Perfect Employees. Start Building Better Performance.
Organizations grow performance; they don’t just hire it. Talent, experience, and skill are all equally important for different facets of a job or task.
However, they all matter within a larger ecosystem. Brilliant hires can lose motivation just as easily as unexceptional people can rise to exceed all expectations. A great team working cohesively will often eclipse a collection of equally brilliant individual players. This situation has been witnessed time and time again, and proven through decades of research into organizational behaviour, yet somehow, organizations almost always resort to the same diagnosis when perceiving any shortfall in performance: “We need to hire better people.”
On the one hand, sometimes, this is true. There is no denying that on more than one occasion, you simply need a better person for that job. On the other hand, every now and then, the truly right person has been put in the wrong job, and no amount of mentoring or coaching can compensate for fundamental misalignment.
If hiring the “right people” becomes the standard operating procedure for addressing performance gaps, organizations risk skipping over a much more complex (and, truthfully, a much less convenient) question:
“Have we actually created an environment in which talented individuals have the chance to flourish?”
Performance Management Starts Long Before the Performance Review
One of the supreme ironies in the business world is that we approach performance management as a process that starts when an employee receives their annual performance appraisal. By then, the decision has already been made.
Performance management starts when you hire the employee, then continues through onboarding, expectations, communications, coaching, trust, leadership, learning, rewards, and all the microinteractions that never make it to the appraisal form. Simply put, the review doesn’t create performance; it just reports it, and that’s a crucial difference because it transforms performance management from a judgmental process into a growth one, and these are two almost completely different things.
One process asks, “How did you perform?” and the other asks, “What do we need to do to help you perform better?” The second question is almost always the more helpful one, because the primary purpose of any organization is to improve performance. Accountability is an essential part of a healthy ecosystem, but simply performing measurements in relation to it is not enough.
The companies that consistently outperform all others recognize this intuitively. They aren’t focused on identifying that mythical, perfect, Herculean employee; rather, they are focused on systems that can help average employees excel, and excellent employees stay excited.
The Biggest Myth Was Never About Talent
We began our foray into this article’s main topic with a counterintuitive notion:
“High performers are born, not made.“
As a collective, humanity has had the Maybelline “Maybe she’s born with it” mentality since we could pick ourselves up from the ground. There are, of course, natural strengths people bring that help them succeed in certain roles, and it would be a disservice to ignore those as much as it would be to discount the importance of talent altogether. Yet, in the grand scheme of things, talent is but a sliver of a larger system. Performance is an intersection of people and the context in which they perform. It depends on leadership, trust, learning opportunities, quality feedback, role clarity, and systems that clear a path versus those that silently raise obstacles.
It’s no surprise, then, that the term “high performer” is somewhat of a red herring. The label invites us to view performance as an identity instead of an output. As soon as we typecast somebody, we ask questions less about what led to that result and more about whether that person is indeed a high performer.
Was it a great insight?
Great leadership?
Decades of training?
An inspiring colleague?
A set of clear objectives?
All of these combined?
Organizations that continue to pose the question invariably get better; organizations that have stopped get better at chasing talent.
Final Thoughts
If performance isn’t simply a matter of talent, then the obvious question follows: what determines employee performance?
The leaders in our organizations? The company culture? Trust? Motivation? Training? Workload? Autonomy?
In reality, as we’ll discuss in the next installment of this series, many “unknown forces, often self-inflicted by the organizations that employees inhabit,” play an enormous role.
Identifying and understanding those forces is the initial stage for creating the conditions for superior performance, rather than something that occasionally appears for high performers. Once organizations stop asking “who are our highest performers,” they can then turn their attention to a more pressing and important question: “What kind of organization helps average people do excellent work?”
*********
Move beyond labeling employees as high or low performers and learn how to build the conditions for better performance. Explore the systems and practices behind effective employee performance management with Certified Employee Performance Management.
Strategy is the set of choices an organization makes about where it wants to go, what it will prioritize, how it will compete, and how it will allocate resources to reach its objectives.
The concept has several established interpretations. Michael Porter describes strategy through competitive positioning and a deliberately different set of activities. Henry Mintzberg presents strategy through five perspectives: plan, ploy, pattern, position, and perspective. The CSBP framework from The KPI Institute also treats strategy as part of a wider performance cycle that connects purpose, objectives, strategic choices, organizational structure, management systems, execution, review, and recalibration.
In practice, strategy answers a deceptively simple question:
What choices must the organization make to achieve the future it wants?
Those choices become meaningful when they influence objectives, resource allocation, initiatives, operating priorities, and performance measures.
This guide explains:
what strategy means
how strategy differs from strategic planning and strategic management
the main types of strategy
the strategic planning process
the tools used for strategic analysis
how strategy moves from corporate objectives to departmental action
What Is Strategy?
Strategy is a coherent set of choices about an organization’s direction, priorities, competitive position, and use of resources.
There is no single definition accepted across the entire strategy literature. A 2024 review of strategic planning research found substantial variation in how strategic planning is defined, particularly in how far the process extends into implementation.
One of the most influential definitions comes from Michael Porter. In his classic article “What Is Strategy?”, Porter distinguishes strategy from operational effectiveness and describes strategy in terms of choosing a distinct position and a different set of activities.
Henry Mintzberg takes a broader view. His 5 Ps of Strategy describe strategy as:
Plan: an intended course of action.
Ploy: a deliberate maneuver in relation to competitors.
Pattern: consistency in decisions and actions over time.
Position: the organization’s place in its external environment.
Perspective: the organization’s way of seeing the world and acting within it.
The CSBP slides use the Mintzberg 5P model to place strategy across past, present, and future perspectives.
A useful working definition for performance management is therefore:
Strategy is the set of choices that determines the organization’s direction, priorities, competitive position, and allocation of resources in pursuit of its objectives.
What Is Strategic Planning?
Strategic planning is the structured process through which an organization analyzes its current situation, defines its desired direction, makes strategic choices, establishes objectives, and determines the initiatives and resources required to move toward those objectives.
The distinction matters.
Strategy describes the choices.
Strategic planning describes the process used to formulate and organize those choices.
Strategic management covers the broader management of strategy, including formulation, implementation, monitoring, learning, and adjustment.
The distinction also appears in recent research. A 2024 study describes strategic planning as process-oriented, while strategy concerns the fundamental choices made to achieve organizational objectives.
The Cambridge Business English Dictionary defines strategic planning as a process in which executives decide what they want to achieve and determine the actions and resources required to do so.
Strategy vs. strategic planning vs. strategic management
Concept
Main question
Typical output
Strategy
What choices will we make?
Strategic choices and direction
Strategic planning
How will we formulate and organize those choices?
Strategic plan
Strategic management
How will we manage strategy over time?
Strategy formulation, execution, monitoring, and review
Strategic planning therefore should not be reduced to producing a document. The research literature treats it as a process, and recent work continues to examine how planning connects with implementation, risk, uncertainty, and organizational performance.
Why Does Strategy Matter?
Strategy provides a basis for making choices about priorities, resources, objectives, and action.
Without strategic choices, organizations can accumulate projects and activities without a clear connection to their intended direction.
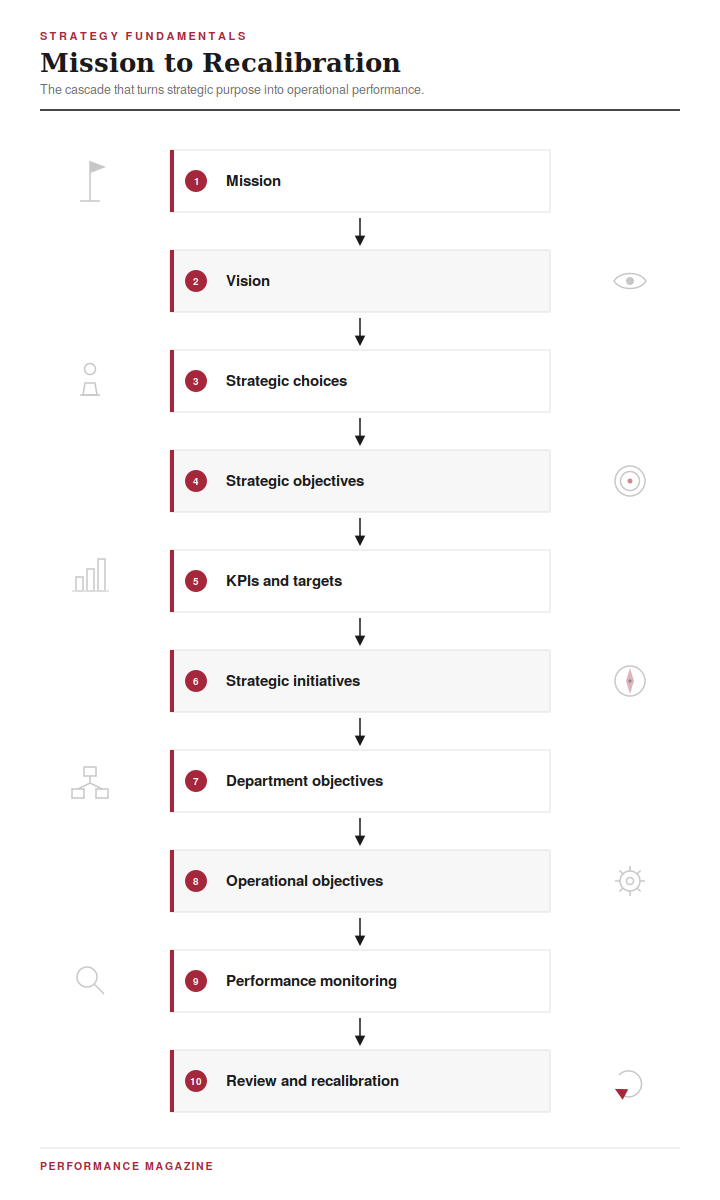
The CSBP framework places strategy inside a broader performance cycle:
Define meaning through mission and values.
Define success through vision and strategic objectives.
Define strategy.
Define the execution structure.
Define the management system.
Execute, review, and recalibrate the strategy.
This creates a connection between strategy and performance management.
A strategy can therefore influence:
Which markets an organization serves
Which customers or stakeholders receive priority
Which products or services receive investment
Which capabilities need development
Which initiatives receive funding
Which risks require attention
Which objectives departments receive
Which KPIs are used to monitor progress
Which activities are treated as business as usual
Which new projects require dedicated resources
The OECD’s 2024 work on strategic planning also highlights the importance of translating long-term vision into priorities and connecting planning with implementation.
What Are the Main Types of Strategy?
Strategy operates at several organizational levels. The CSBP framework illustrates a hierarchy that runs from the corporate level through regional, business-unit, functional, team, and employee levels.
1. Corporate Strategy
Corporate strategy concerns the organization as a whole.
It addresses questions such as:
Which businesses or markets should the organization participate in?
Where should resources and investment go?
Should the organization grow, maintain its current position, or reduce its scope?
Which businesses or activities belong within the corporate portfolio?
Corporate strategy becomes particularly important when an organization operates across multiple businesses, markets, or geographical areas.
2. Competitive or Business Strategy
Competitive strategy concerns how a business competes within a particular market.
Porter’s work places competitive positioning at the center of strategy. The CSBP framework presents several competitive strategy options, including:
Low-cost, low-price strategy
Differentiation
Customer service and relationship strategy
Networking-effect strategies
Porter’s Five Forces can also help organizations examine the competitive environment through:
Existing competitors
New entrants
Bargaining power of buyers
Bargaining power of suppliers
Substitute products or services
The central issue is strategic choice. An organization needs to understand the basis on which it intends to compete and whether its activities support that position.
3. Functional Strategy
Functional strategy translates higher-level strategic choices into priorities for functions such as:
Marketing
Finance
Human resources
Operations
Information technology
Procurement
Research and development
A functional strategy should connect departmental priorities to corporate or business-unit objectives.
The CSBP framework treats this connection as a cascading process. Corporate objectives can be transferred to departments as the same objective when a department owns or directly contributes to it, or as supporting objectives when the department contributes indirectly.
4. Growth Strategy
Growth strategy addresses how an organization intends to expand.
The CSBP slides identify several approaches:
Intensive growth
The organization seeks greater market share within its current geographical market.
Integrative growth
The organization expands across the value chain through approaches such as:
Backward integration
Forward integration
Horizontal integration
Diversification
The organization expands into related or unrelated areas beyond its existing sector.
Internationalization
The organization expands across geographical borders through mechanisms such as alliances, joint ventures, franchising, licensing, mergers and acquisitions, or other international models.
Growth is therefore a strategic choice rather than a single formula.
What Is the Strategic Planning Process?
A strategic planning process usually moves from understanding the organization and its environment to making strategic choices, setting objectives, allocating resources, and executing the resulting initiatives.
The exact sequence varies by organization. The CSBP framework provides a useful integrated structure.
Step 1: Define the organization’s identity
Strategy starts with the organization’s underlying purpose and identity.
This includes:
Mission
Values
Corporate capabilities
Desired impact
Vision
The CSBP material distinguishes mission from impact. The impact describes the change the organization wants to create, while the mission describes how it intends to create that change.
Corporate capabilities also matter because strategy depends on what the organization can actually do. The course defines capabilities as the collective skills, abilities, and expertise of an organization.
Step 2: Conduct an Internal Environment Analysis
An internal environment analysis examines what the organization currently has and how effectively it operates.
The CSBP framework examines:
Processes
Procedures
Resources
Functional and structural perspectives
The analysis asks several practical questions:
What resources do we have?
How well do our processes work?
Which capabilities support our strategy?
Where are the gaps between what exists and what the strategy requires?
The resource analysis covers:
Financial resources
Human resources
Information resources
Material resources
Knowledge and expertise
The purpose is to establish a realistic picture of organizational capacity. The CSBP framework describes the internal scan as a way to anchor strategic planning in the current reality and identify gaps between existing and required capabilities.
Step 3: Analyze the External Environment
Organizations operate within environments they cannot fully control.
The CSBP framework separates the external environment into:
Macro-environment: broad forces outside the organization’s direct control
Micro-environment: actors and forces involved in transactions with the organization
Several tools can support this analysis.
PESTEL analysis
PESTEL examines six categories:
Political
Economic
Social
Technological
Environmental
Legal
The CSBP process moves through four stages:
Identify relevant factors.
Identify possible changes.
Examine relationships among factors.
Assess whether each factor could represent an opportunity or threat.
A 2026 academic review of PESTEL notes that the framework remains widely used across strategic and policy research, while also warning against treating it as a simple checklist. Environmental analysis has limits. It cannot predict the future or remove uncertainty on its own.
That distinction matters. A long list of external factors is not a strategy.
Porter’s Five Forces
Five Forces examines the competitive structure of an industry through:
Competitive rivalry
Threat of new entrants
Buyer power
Supplier power
Threat of substitutes
It helps answer a different question from PESTEL.
PESTEL asks: What is changing in the wider environment?
Five Forces asks: What competitive pressures affect the industry’s economics?
The two analyses can therefore complement each other.
Step 4: Use SWOT Analysis Carefully
SWOT organizes strategic factors into four categories:
Internal
External
Strengths
Opportunities
Weaknesses
Threats
The CSBP framework distinguishes internal strengths and weaknesses from external opportunities and threats.
SWOT becomes more useful when the analysis leads to strategic questions:
Which strengths can support strategic objectives?
Which weaknesses could restrict execution?
Which opportunities deserve strategic attention?
Which threats require a response?
Which strategic objectives should be added because of the analysis?
The CSBP framework makes an important distinction here: SWOT does not create the strategy by itself. Its output is additional strategic objectives that can feed into the strategy tree.
Recent research also continues to examine limitations in conventional SWOT, including subjectivity and difficulty in prioritizing factors.
Step 5: Use Scenario Planning for Uncertainty
Scenario planning considers several plausible ways the external environment could develop.
The CSBP framework distinguishes scenarios from SWOT in an important way:
SWOT examines individual threats and opportunities. Scenario planning considers combinations of threats and opportunities that could produce different future conditions.
A scenario planning process can ask:
What major uncertainties could affect the organization?
What combinations of factors could produce different future conditions?
How would each scenario affect strategic KPIs?
Which indicators should management monitor during execution?
Recent research describes scenario planning as a process that develops alternative stories about the future and uses them to challenge current assumptions and develop more robust strategies.
Step 6: Define the Vision
A vision describes the organization’s desired future state.
The CSBP framework defines vision as the organization’s desirable future and describes it as a qualitative statement that defines success.
A useful vision should answer:
What will the organization become?
The vision then gives strategic planning a future reference point.
The CSBP material uses a longer-term horizon for vision and then translates it into objectives at shorter time horizons.
Step 7: Translate the Vision Into Strategic Objectives
A vision is difficult to manage unless it can be translated into specific outcomes.
Operational objectives: Annual targets and actions that contribute to the strategic objective.
This translation creates a bridge between strategic intent and performance measurement.
Step 8: Build a Strategy Tree
A strategy tree shows the cause-and-effect relationships among strategic objectives.
The CSBP framework uses a simple question:
To achieve this objective, what do we need?
Each strategic objective should lead logically to the objectives beneath it. The framework asks whether the lower-level objectives are necessary and sufficient to reach the higher-level objective.
A strategy tree can therefore look like:
Vision
↓
Long-term objective
↓
Strategic objective A Strategic objective B Strategic objective C
↓
Supporting strategic objectives
↓
Operational objectives
↓
KPIs and targets
This structure gives performance managers a way to test whether the strategy has a coherent logic.
Step 9: Choose Strategic Initiatives
Objectives describe what the organization needs to achieve.
Strategic initiatives describe what the organization will undertake to achieve those objectives.
The CSBP framework connects strategic objectives with corporate initiatives, programs, projects, and organizational structures.
At departmental level, the process includes identifying a portfolio of projects that supports the corporate competitive and growth choices. Each initiative should have its risks, resources, and schedule considered.
This distinction is useful:
Strategy element
Question
Vision
Where do we want to be?
Strategic objective
What result must we achieve?
KPI
How will we measure it?
Target
What level of performance do we require?
Initiative
What major undertaking will contribute to it?
Project
What specific temporary effort will deliver it?
Business as usual
What ongoing activities will support it?
Step 10: Cascade Strategy Across the Organization
Corporate strategy has limited practical effect if it stays at the corporate level.
The CSBP framework cascades strategic objectives through organizational levels, from corporate objectives to departments and employees.
At department level, organizations can:
Communicate corporate objectives.
Cascade relevant objectives.
Establish supporting departmental objectives.
Identify projects and initiatives.
Estimate resources and schedules.
Identify risks.
Coordinate with other departments.
Align departmental strategies with corporate strategy.
This also addresses one of the recurring problems in strategic management: a disconnect between organizational priorities and functional activity.
Strategy Execution: From Objectives to Action
Strategy execution is the point at which strategic choices become organizational activity.
The CSBP framework separates departmental work into two broad categories:
Business as usual
These are ongoing activities that can become part of an employee’s or department’s normal responsibilities.
New projects
These are new undertakings that require dedicated teams, budgets, planning, or other resources.
New strategic projects can then move into more detailed project planning. The CSBP slides reference project charters, work breakdown structures, Gantt charts, resource plans, budgets, and portfolio monitoring.
Strategy execution therefore requires more than a strategic plan. It requires a management system that connects objectives, initiatives, resources, responsibilities, measures, and review.
What Are the Most Common Strategy Frameworks?
Several frameworks are frequently used during strategic planning.
Framework
Main purpose
PESTEL
Examine the macro-environment
Porter’s Five Forces
Examine industry competition
SWOT
Organize internal and external strategic factors
Scenario planning
Explore plausible future conditions
Strategy tree
Show relationships among strategic objectives
SMART objectives
Specify measurable strategic outcomes
Business model analysis
Examine how the organization creates and captures economic returns
Strategy map
Connect objectives through cause-and-effect relationships
No single framework answers every strategic question.
The appropriate tool depends on the decision being made.
Recent strategic planning research also supports a broader view of the planning process rather than treating individual frameworks as complete strategy methodologies.
What Makes a Strategic Objective Different From a Goal?
A goal can express a broad desired outcome.
A strategic objective is more precise.
The CSBP framework describes an objective as a brief but explicit statement of what the organization intends to achieve as a result of implementing its strategy. It then links the objective to a KPI, target, timeframe, and owner.
For example:
Broad goal: Improve customer satisfaction.
Strategic objective: Increase customer satisfaction from 60% to 85% by the end of 2027.
KPI: Customer satisfaction rate.
Target: 85%.
Timeframe: End of 2027.
Owner: Marketing Director.
The additional specificity makes the objective easier to monitor.
Strategy and Performance Management
Strategy and performance management are closely connected because strategic choices determine what the organization intends to achieve, while performance management provides mechanisms for measuring progress toward those outcomes.
The connection can be represented as:
The CSBP deck explicitly places strategy inside the performance cycle and connects strategy with vision, objectives, initiatives, organizational structure, management systems, execution, review, and recalibration.
The OECD’s recent work similarly stresses the connection between long-term vision, priorities, implementation, and review within strategic planning systems.
Common Strategy Mistakes
1. Treating strategy as a document
A strategic plan can document strategy, but the document itself is not the strategy.
Strategy requires choices that influence organizational decisions.
2. Confusing operational improvement with strategy
Improving efficiency can be important. It does not automatically constitute a strategic choice.
Porter’s distinction between operational effectiveness and strategy remains useful here.
3. Treating SWOT as the strategy
SWOT can identify factors that deserve strategic attention. The CSBP framework specifically states that SWOT alone cannot create the strategy.
4. Creating objectives without a strategic logic
A collection of objectives does not automatically form a strategy.
The strategy tree addresses this issue by asking whether objectives are necessary and sufficient to support higher-level objectives.
5. Setting corporate objectives without cascading them
Departmental and individual priorities can drift away from corporate priorities when objectives remain at the top of the organization.
The CSBP planning model therefore includes objective cascading and interdepartmental alignment.
6. Ignoring resources
A strategy that requires capabilities or resources the organization does not possess needs further analysis.
The CSBP internal environment framework treats resources as both strategic inputs and potential constraints.
7. Assuming the external environment will remain stable
Strategic planning needs mechanisms for monitoring external change.
The CSBP framework recommends ongoing environmental scanning and an early-warning system that tracks emerging events and trends.
Strategy Example
Consider a fictional regional professional education organization.
Its vision is to become a leading provider of professional education across Southeast Asia.
Its strategic planning process could look like this:
1. Internal analysis
The organization identifies strong subject-matter expertise but limited regional distribution capacity.
2. External analysis
PESTEL identifies regulatory and technological changes affecting professional education. Five Forces identifies competitive pressure from universities, specialist training providers, and digital platforms.
3. Strategic choice
Management chooses regional expansion through digital delivery and selected local partnerships.
4. Strategic objectives
Increase Southeast Asian revenue.
Expand the number of markets served.
Increase digital course enrollment.
Develop regional delivery capabilities.
5. Strategic initiatives
Launch localized digital programs.
Establish regional partnerships.
Build a multilingual content portfolio.
Develop a regional marketing and distribution program.
6. Departmental cascade
Marketing, publishing, technology, finance, and learning teams establish supporting objectives and projects.
7. Performance measurement
KPIs track indicators such as:
Regional revenue
Digital enrollment
Market penetration
Course completion
Customer acquisition cost
Partner contribution
Revenue by market
The example shows the basic logic of strategy:
Where are we now? → Where do we want to go? → What choices will take us there? → What must the organization achieve? → What must each function do? → How will we measure progress?
Frequently Asked Questions About Strategy
What is strategy in simple terms?
Strategy is a set of choices about where an organization wants to go, how it intends to compete or operate, what it will prioritize, and how it will use its resources to achieve its objectives.
What is strategic planning?
Strategic planning is the process of analyzing the organization’s situation, defining its direction, making strategic choices, setting objectives, and planning the initiatives and resources required to pursue them.
What is the difference between strategy and strategic planning?
Strategy concerns the choices an organization makes. Strategic planning is the structured process used to formulate and organize those choices.
What are the main types of strategy?
Common categories include corporate strategy, competitive or business strategy, functional strategy, and growth strategy.
What are the main steps in strategic planning?
A typical process includes defining organizational identity, analyzing the internal and external environment, defining the vision, choosing strategic directions, establishing strategic objectives, selecting initiatives, cascading objectives, allocating resources, executing the strategy, and reviewing performance.
The exact process varies by organization.
What is a strategic objective?
A strategic objective is a specific statement of an outcome the organization intends to achieve through its strategy. It can be linked to a KPI, target, timeframe, and responsible owner.
What is a strategy tree?
A strategy tree is a visual representation of cause-and-effect relationships among strategic objectives. It shows how lower-level objectives contribute to higher-level objectives.
What is SWOT analysis used for?
SWOT organizes internal strengths and weaknesses and external opportunities and threats. It can generate additional strategic objectives and strategic questions, but it should not be treated as a complete strategy methodology.
What is PESTEL analysis?
PESTEL is an environmental analysis framework that examines Political, Economic, Social, Technological, Environmental, and Legal factors.
How does strategy connect to KPIs?
Strategy establishes the outcomes the organization wants to achieve. Strategic objectives translate those outcomes into specific results, while KPIs measure progress toward those results.
How often should strategy be reviewed?
There is no universal review interval. Organizations need a review rhythm that fits their environment, planning cycle, strategic horizon, and rate of change. The CSBP framework includes execution, review, and recalibration as part of the performance cycle.
All About Choices
Strategy is ultimately about choices.
A strong strategic planning process connects those choices to organizational identity, environmental analysis, competitive and growth decisions, strategic objectives, initiatives, resources, and performance measurement.
The core sequence can be summarized as:
Define the organization → analyze the environment → define the future → make strategic choices → establish objectives → build the strategy tree → select initiatives → cascade strategy → execute → measure → review and recalibrate.
Strategic planning gives this sequence structure. Strategic management keeps it connected to organizational decisions and performance over time.
Employee Performance Management (EPM) is the structured, ongoing process of setting expectations, tracking results, and developing people so that individual effort connects to organizational goals. It is not the annual review form. The review is one meeting inside a much longer cycle that runs from goal-setting through coaching, measurement, evaluation, and reward.
This guide covers:
What Employee Performance Management is, and how it differs from a performance appraisal
How EPM operates across organizational, departmental, individual, and personal levels
Why organizations invest in EPM, and what happens when they don’t
The EPM architecture: the building blocks that connect strategy to a single employee’s daily work
How to run an effective appraisal meeting, including feedback techniques
How EPM connects to talent management, career planning, and succession
Common mistakes organizations make when implementing EPM
What Is Employee Performance Management?
Employee Performance Management is a structured process of planning, measuring, and improving how an individual employee contributes to organizational results. It typically involves setting objectives and KPIs, tracking progress, evaluating results against standards, giving feedback, and using what’s learned to guide development, pay, and career decisions.
Ask a room of employees what “performance” means to them and the answers tend to split down the middle. Some see it as a way to earn a bonus or a promotion. Others describe it as a bureaucratic, time-consuming exercise. In between sit people who say it clarifies their objectives, motivates better work, or builds their competencies. All of these reactions are valid, and they usually reflect how well — or how badly — an organization has built its EPM system. A well-designed system produces the motivating, clarifying version. A poorly designed one produces the bureaucratic, box-ticking version.
That gap is the entire reason EPM exists as a discipline: the same underlying idea — measuring and improving people’s work — can land as either a genuine driver of performance or a resented compliance exercise, depending entirely on how it’s structured.
Performance Management Operates at Multiple Levels
Performance management isn’t a single activity; it operates at different altitudes, each with its own focus and its own tools.
Strategic (organizational) level. Deals with the achievement of overall organizational objectives. This is where mission, vision, values, and 3-to-5-year goals get set, and it’s sometimes called corporate, business, or enterprise performance management.
Operational (departmental) level. Puts the accent on achieving departmental objectives inside the organization, translating strategy into functional plans. Dashboards are the tool of choice here.
Individual level. An integrated system meant to improve the performance of each employee, with responsibilities aligned toward the achievement of shared goals. This is the level most people mean when they say “performance management.”
Personal level. Full self-management across life areas — a structured approach an individual applies to their own balance and development, separate from any organizational system.
A useful test: an executive board meeting to review strategy is strategic; monitoring overtime or deploying work activities toward individual objectives is individual; department restructuring based on established goals is operational; tracking your own steps per day is personal. Confusing these levels — running individual-level conversations with strategic-level tools, for example — is one of the fastest ways to make an EPM system feel disconnected from real work.
Why Employee Performance Management Matters
EPM earns its place in an organization when it changes behavior, not just when it produces a score. Done well, it:
Improves quality of work by defining clear expectations for each role
Brings better understanding of work processes, so employees know not just what to do but why
Aligns the efforts of each employee to corporate strategy, closing the gap between the boardroom and the desk
Reduces subjectivity in decision-making around pay, promotion, and development
Assures continuous learning and improvement of individual performance over time
That last point matters more than it looks. The same measurement activity can serve very different purposes: measurement for improvement and measurement for understanding your role build trust; measurement mania, measurement for control, and measurement for sanctioning erode it. Two organizations can run an identical KPI dashboard and get opposite results, depending on which of these purposes the dashboard actually serves.
The shift in communication style tracks the same divide. Annual evaluations built on one-way, unilateral, manager-to-employee communication tend to feel punitive. On-going performance discussions built on two-way, bilateral dialogue and feedback tend to feel developmental — even when they’re measuring the exact same KPIs.
The EPM Architecture
Employee Performance Management doesn’t function as one form or one meeting; it’s a set of connected building blocks that carry strategy down to an individual’s daily work and back up again as evidence.
At the top, the Strategic Plan at organizational level and the Operational Plan at functional level feed a Competencies Framework and a Behaviors Framework, both anchored in a formal Performance Management Policy.
Those frameworks, together with the job description, are used for establishing performance criteria — the objectives, KPIs, competencies, and behaviors an individual will be measured against — which in turn shape that person’s career plan.
Through the year, performance is tracked via an individual performance (IP) scorecard, a daily log, competencies and behaviors observations, and informal feedback — the raw material for the formal IP evaluation.
That evaluation feeds a development plan (linked to a training policy and training plan) and a set of reward-and-recognition decisions: a rewards policy, a pay-for-performance plan, succession management, and employee engagement.
Four levels sit underneath this architecture:
When this architecture is built correctly, a single employee’s daily task log can be traced all the way up to a strategic objective — and a strategic objective can be traced back down to the specific behaviors expected of the person doing the work.
The Employee Performance Management Cycle
At its core, the EPM cycle runs through five stages: planning, monitoring, developing, rating, and rewarding.
Performance setting meeting. The manager and employee set performance objectives, set development goals, and agree on the resources the employee will need. This is where standards get communicated and both assessor and assessed are prepared for what’s coming.
On-going performance evaluation. Through the year, actual performance is measured against the standards set. This isn’t a single event — it’s continuous monitoring, informal feedback, and course-correction.
Mid-year review. Results to date are discussed, formal feedback is given, and improvement opportunities are planned. Both manager and employee prepare for this meeting in advance. Its results do not influence the year-end evaluation — it exists purely to course-correct.
End-of-year appraisal. Past performance is discussed, potential is identified, and career path and development aspects are addressed.
Reward. When standards are reached, the cycle closes with recognition — tied to a rewards policy and, often, a pay-for-performance plan. When standards aren’t reached, the cycle instead produces improvement measures and feeds back into planning for the next cycle.
Underneath every step, four roles carry distinct responsibilities:
The manager discusses objectives, KPIs, and standards with the employee; aligns responsibilities; provides resources; evaluates performance and gives feedback; conducts appraisal meetings; and fills in scorecards.
The employee contributes to setting their own objectives and the methods to reach them, prepares self-evaluations, and contributes to setting their own development measures.
Senior management establishes business strategy, validates appraisal results, manages disagreements between employee and manager, and validates the decisions that come out of appraisals.
HR coordinates the administrative process and provides support and counsel to both sides.
Measuring and Rating Performance
Most EPM systems combine three inputs into a single performance score: results (KPIs), competencies, and behaviors. Two common ways to combine them:
Weighted average: KPI score × x% + Competencies score × y% + Behaviors score × z%, where x + y + z = 100% — for example, weighting results at 70%, competencies at 20%, and behaviors at 10%
Results themselves are usually scored against a target band — results meeting target (typically above roughly 95% of target), results in a tolerance interval (roughly 90–95%), and results far from target (below roughly 90%). Overall performance is then translated into a rating scale, commonly a five-point scale running from Unsatisfactory through Needs Improvement, Meets Expectations, and Exceeds Expectations, up to Exceptional. Competencies and behaviors are frequently rated on a similar five-point frequency scale (Never through Always).
These scores are also the raw material for talent-review tools like the 9-box grid, which plots current performance against future potential to guide succession and development conversations.
Running the Appraisal Meeting
The appraisal meeting is the most visible part of EPM, and also the part most likely to go wrong if it isn’t structured. A well-run meeting typically follows this shape:
Opening: create a positive climate, review the meeting’s objectives, and agree on its structure
Performance analysis: go topic by topic through results and appreciation, discuss causes and consequences, and only move to the next topic once agreement is reached — without negotiating the facts
Improvement initiatives: set concrete steps by mutual agreement, support the employee in achieving future performance, and put the agreement in writing
Useful questions to structure that discussion include how the employee reached their targets, what factors helped or hurt the results, how they assess their own performance, which competencies they used most (and least), and what they’d suggest to remove obstacles going forward.
Feedback quality inside that meeting matters as much as the structure. The research is blunt about the stakes: companies with regular employee feedback see meaningfully lower turnover, and highly engaged employees report getting feedback far more often than disengaged ones — while employees who are ignored by their manager are roughly twice as likely to disengage. Most employees say they want more feedback than they’re getting; most managers believe they’re already giving enough.
Good feedback, whether reinforcing or redirecting a behavior, tends to follow the same shape: describe the specific behavior, explain its impact, listen to the recipient’s reaction, and land on a concrete plan for what happens next. Vague praise (“you’re doing a great job, keep it up”) and personal criticism (“don’t you know anything about this?”) both fail for the same reason — neither one tells the employee which specific behavior to repeat or change.
EPM and Talent Management
Performance data doesn’t stop at the appraisal. It feeds directly into talent management: career planning, coaching and mentoring, internal talent mobility, succession management, and leadership development. An employee’s demonstrated competencies and results are the evidence base for their career plan and for whether they’re a candidate for succession into a more senior role. Succession management, in turn, protects the organization against the risk of losing critical knowledge and capability when someone leaves — building a pipeline rather than scrambling to fill a vacancy after the fact.
Common EPM Mistakes
A handful of failure patterns show up repeatedly:
Treating it as an annual event. A system built around a once-a-year form, with no on-going monitoring or mid-year check-in, turns into a post-mortem rather than a tool for real-time course correction.
One-way communication. Performance management delivered top-down, without dialogue, feels imposed rather than owned — and employees disengage from targets they had no hand in setting.
Measurement without purpose. When KPIs are tracked for control or sanction rather than improvement, the system breeds defensiveness instead of better performance.
Vague feedback. Praise or criticism that doesn’t name a specific behavior gives the employee nothing to repeat or change.
Disconnected levels. When individual objectives aren’t visibly linked to departmental and strategic goals, employees can’t see why their work matters — and the architecture that’s supposed to connect strategy to daily work breaks down.
No follow-through. An evaluation that doesn’t feed a development plan, a reward decision, or a career conversation is data collected for no purpose.
Most of these trace back to the same root problem: a system designed around administering a form, rather than around the ongoing manager–employee dialogue the form is supposed to support.
Frequently Asked Questions
What is the difference between performance management and a performance appraisal? The appraisal is a single meeting — usually the end-of-year evaluation. Performance management is the full cycle around it: planning, monitoring, developing, rating, and rewarding.
How often should performance be reviewed? Most modern EPM systems combine a formal planning meeting and a formal year-end appraisal with an interim mid-year review and continuous informal feedback in between — rather than relying on one annual conversation.
What’s the difference between a competency and a behavior in this context? Competencies are the skills and capabilities an employee brings to a role. Behaviors are how they’re expected to act day to day in pursuit of their targets, usually defined in an organization-wide behaviors framework that applies to all personnel.
Who owns the performance management process? Senior management sets strategy and validates outcomes, HR coordinates the administrative process and offers support, and the manager and employee jointly own the day-to-day objective-setting, tracking, and feedback.
How does EPM connect to pay? Through a pay-for-performance plan that’s explicitly linked to the individual performance evaluation — one of several outputs, alongside development plans, training plans, and succession decisions, that come out of a properly closed EPM cycle.
A Key Performance Indicator (KPI) is a measurable expression of the achievement of a desired level of results in an area relevant to the evaluated entity’s activity. This is the definition used by The KPI Institute, a global research, training, and consultancy organization with more than 22 years of experience in performance management.
In practical terms, a KPI is a measure used to evaluate progress toward an important organizational, departmental, team, or individual objective. A KPI is not simply any number an organization can track; it is a measure selected for its relevance to a desired result and its usefulness in evaluating and improving performance.
This guide examines:
What makes a measure a KPI and how the concept is defined within The KPI Institute’s performance management framework
How KPIs differ from metrics, measures, Performance Indicators (PIs), and Key Risk Indicators (KRIs)
How KPIs operate at corporate, departmental, team, and individual levels and connect performance to organizational objectives
Why KPIs matter for clarity, focus, improvement, engagement, communication, and organizational learning
The different types of KPIs, including leading and lagging indicators, strategic and operational KPIs, and count, percentage, and monetary measures
How KPIs fit within the Balanced Scorecard and its four perspectives for measuring and managing organizational performance
How to formulate a good KPI, from defining the objective to applying SMART criteria
How the KPI lifecycle works, including the establishment, use, review, and evolution of KPIs
Practical KPI examples by department, covering finance, human resources, sales and marketing, operations, and IT and service management
Common KPI mistakes and the performance management practices that can help organizations avoid them
What Is a Key Performance Indicator (KPI)?
The most cited definition of a KPI comes from The KPI Institute. The Institute defines a KPI as “a measurable expression for the achievement of a desired level of results in an area relevant to the evaluated entity’s activity.”
Break that down and three things stand out. First, a KPI has to be measurable. Second, it points to a desired result, not just an observation. Third, it only counts if it sits in an area that matters to whoever is being measured, whether that’s a company, a department, a team, or a single employee.
A KPI is not a stand-in for “anything you can count.” Website visits, email opens, or the number of meetings held in a week are data points. They only become KPIs once they connect to a specific objective and someone acts on the result. That connection to strategy is what separates a KPI from ordinary business data, and it’s also the single most common thing organizations get wrong.
KPIs Operate at Multiple Levels
A KPI rarely stands alone. It usually sits inside a chain that runs from the boardroom down to a single desk.
Corporate level: KPIs here back strategic alignment and executive decisions. Think $ Revenue Growth or % Market Share.
Departmental level: KPIs guide functional effectiveness inside a single team, such as % On-Time Delivery in operations or % Retention Rate in HR.
Individual level: Personal KPIs connect one person’s work to the bigger goal, such as # Projects De9/3/2026Slivered On Time for a project manager.
When these three levels are built correctly, a frontline employee can trace a straight line from their own KPI to a strategic objective on the board’s scorecard. That line of sight is one of the clearest signs of a mature performance system, and its absence is one of the clearest signs of a broken one.
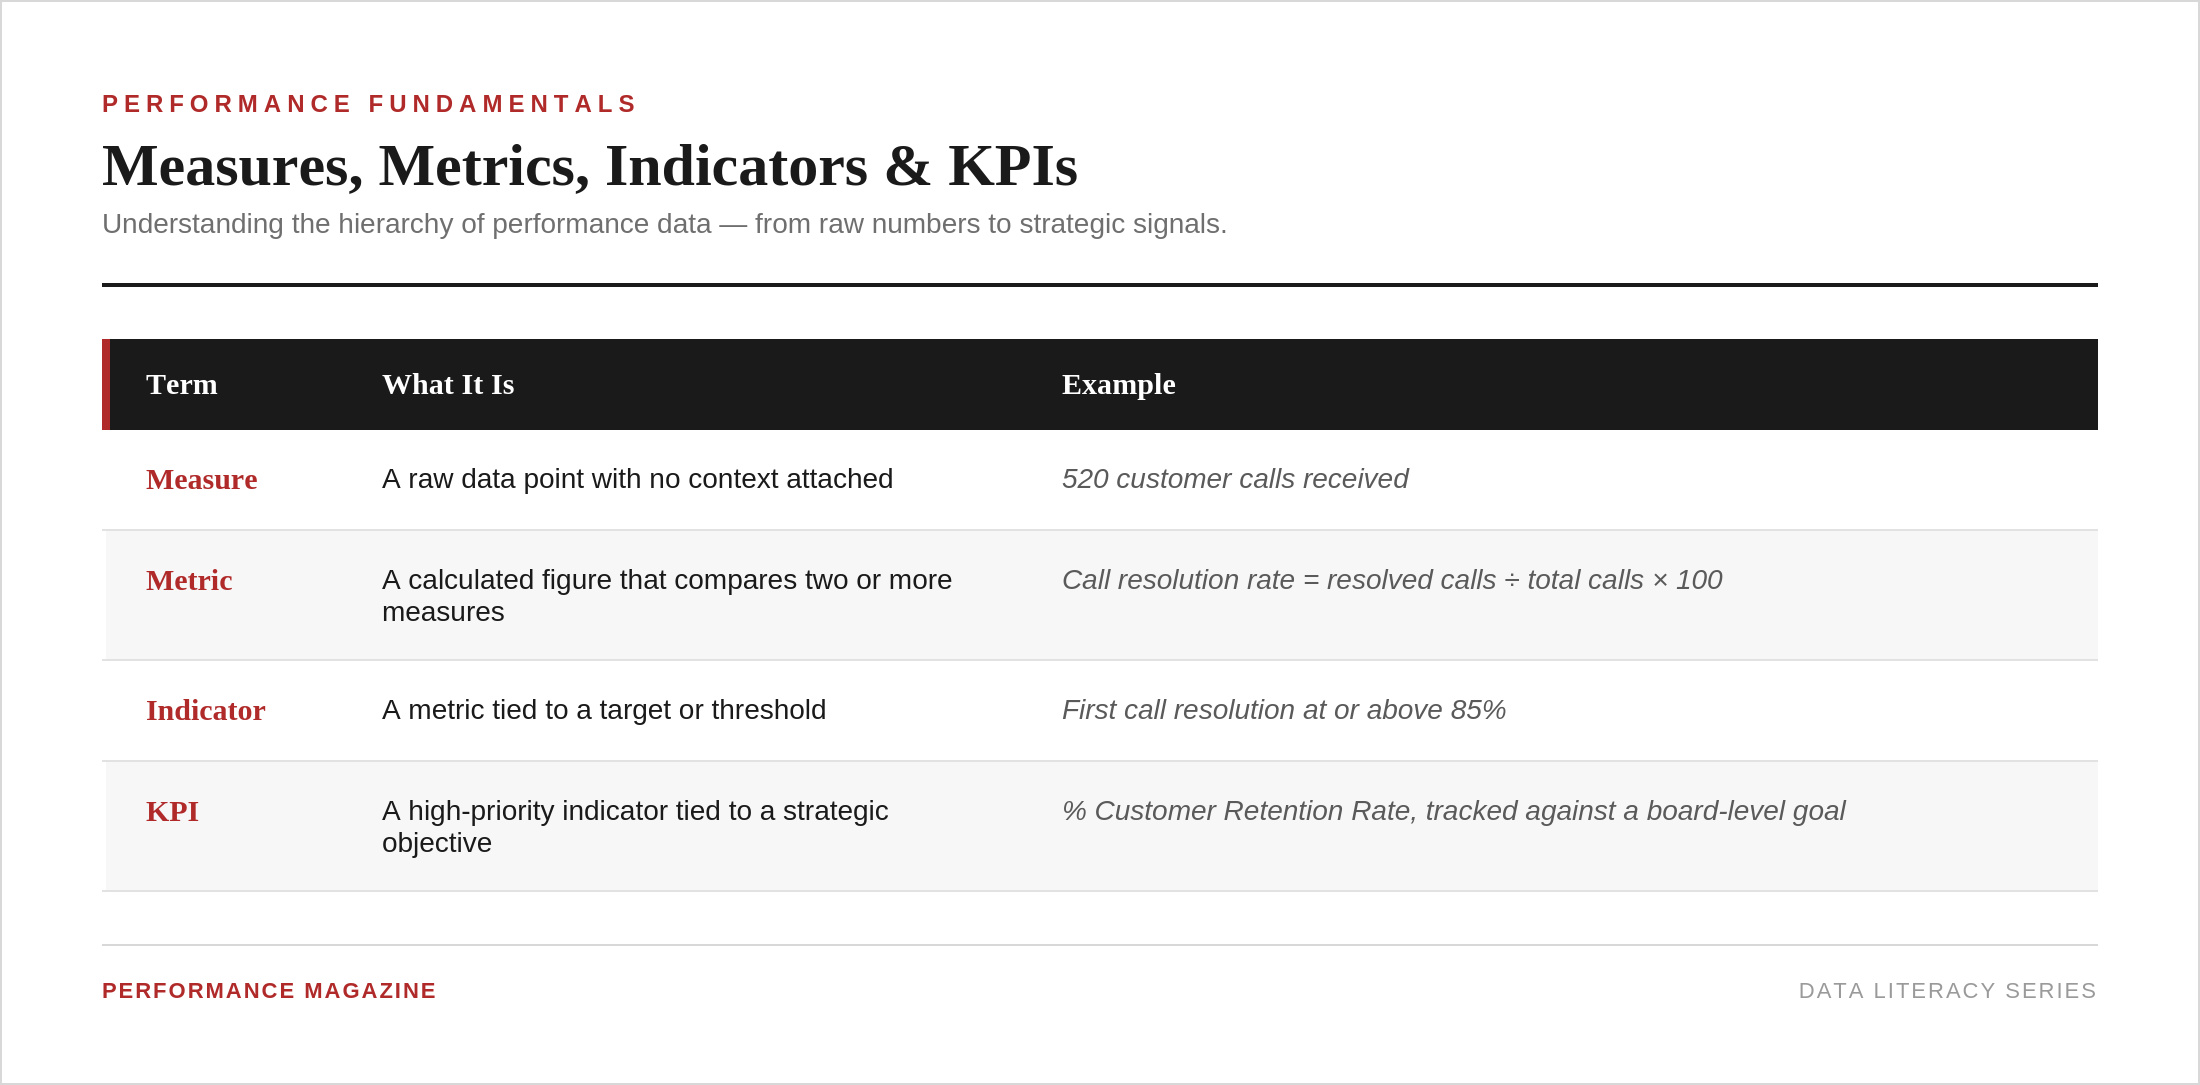
KPI vs. Metric vs. Measure vs. Indicator
These four words get used as if they mean the same thing. They don’t, and mixing them up is one of the fastest ways to end up with a bloated, confusing dashboard.
Data moves up this chain: from raw measure, to metric, to indicator, to KPI. Most organizations track hundreds of metrics. Very few of those metrics deserve KPI status, because a KPI is reserved for the handful of numbers senior leadership actually uses to make decisions.
Where KRAs, PIs, and KRIs Fit In
The KPI Institute’s Body of Knowledge places KPIs inside a wider hierarchy of performance terms. Getting this right matters for anyone building a scorecard or a reporting structure.
Key Result Area (KRA): A broad domain where an organization has to perform well, such as Customer Experience or Operational Efficiency. A KRA is not measurable on its own; it needs indicators underneath it.
Key Performance Indicator (KPI): A high-priority, strategically significant measure tied to a KRA and reported to senior leadership.
Performance Indicator (PI): A supporting measure, relevant at the team or process level but not critical enough to reach the executive scorecard. Think # Daily Orders Processed rather than % Customer Retention Rate.
Key Risk Indicator (KRI): A forward-looking measure that flags a threat before it damages performance. Where a KPI asks “are we hitting our goals,” a KRI asks “what could stop us.”
Together, these terms form a structure that runs from strategic intent down to the data behind a single report. Companies that skip this structure tend to end up with dashboards full of numbers nobody uses.
Why KPIs Matter
A KPI is worth building only if it changes behavior. The KPI Institute’s research points to six areas where well-designed KPIs pay off.
Clarity. A KPI turns a vague ambition like “get better at customer service” into something concrete, such as % First Call Resolution. Teams stop guessing at what success looks like. Example: a retail chain that tracks $ Sales per Square Foot gets a single number that lines up real estate, merchandising, and store operations around one shared measure of location performance.
Focus. With a small set of KPIs in place, attention goes to what actually drives results instead of spreading across everything that can be counted. Example: a hospital that tracks # Average Patient Wait Time channels staff effort into the specific process fixes that shorten delays.
Improvement. A KPI trending in the wrong direction is a prompt for action, whether that means a root-cause review or a new initiative. Example: a software company watching # Issue Resolution Time climb can launch a code review process before customer satisfaction takes the hit.
Engagement. Employees who can see how their daily work moves a KPI tend to feel more ownership over the outcome than employees who only hear about targets secondhand. Example: a call center agent measured on % First Call Resolution understands their effect on customer loyalty, not just call volume.
Communication. KPIs give departments and executives a common language, which cuts down on the back-and-forth that happens when everyone reports numbers differently. Example: an ESG report built around # CO₂ Emissions per Product tells shareholders and customers a consistent story about environmental performance.
Learning. Over time, KPI trends and benchmarks become a record of what worked and what didn’t, and that record is worth more the longer an organization keeps it. Example: a marketing team reviewing a falling $ Cost per Lead across several campaigns can trace which tactics worked and repeat them.
Types of KPIs
KPIs get classified a few different ways, and it helps to know all three.
By timing. Leading indicators predict future performance (# Sales Pipeline Opportunities). Lagging indicators confirm what already happened (% Net Profit Margin). A balanced scorecard needs both, because leading indicators alone can be unreliable, and lagging indicators alone arrive too late to act on.
By scope. Strategic KPIs sit at the corporate level and matter to the board. Operational KPIs track a specific process or team, often on a weekly or monthly cycle, and roll up into the strategic picture.
By format. The KPI Institute’s naming convention tags every KPI with a symbol that signals what kind of number sits behind it:
# (count): # New Clients, # Incidents Resolved
% (rate or proportion): % Customer Satisfaction, % Employee Turnover
$ (monetary figure): $ Revenue per Employee, $ Cost per Unit
This small convention does a lot of work. Anyone who looks at a dashboard can tell at a glance whether they’re looking at a count, a rate, or a dollar figure, without reading the full label.
The Balanced Scorecard: Where Most KPIs Live
Kaplan and Norton introduced the Balanced Scorecard in a1992 Harvard Business Review article as a way to measure performance beyond financial results alone. It groups KPIs into four perspectives:
Financial: Revenue Growth Rate, Net Profit Margin, Return on Investment
Customer: Customer Satisfaction, Net Promoter Score, Customer Retention Rate
Internal Process: Process Cycle Time, Error Rate, Time to Market
People, Learning & Growth: Employee Engagement Score, Training Hours per Employee, Internal Promotion Rate
By 1996 the same framework had already expanded from measurement into strategy execution. Most modern KPI frameworks, including The KPI Institute’s own, still lean on this four-perspective structure because it forces a company to look past the income statement.
How to Write a Good KPI
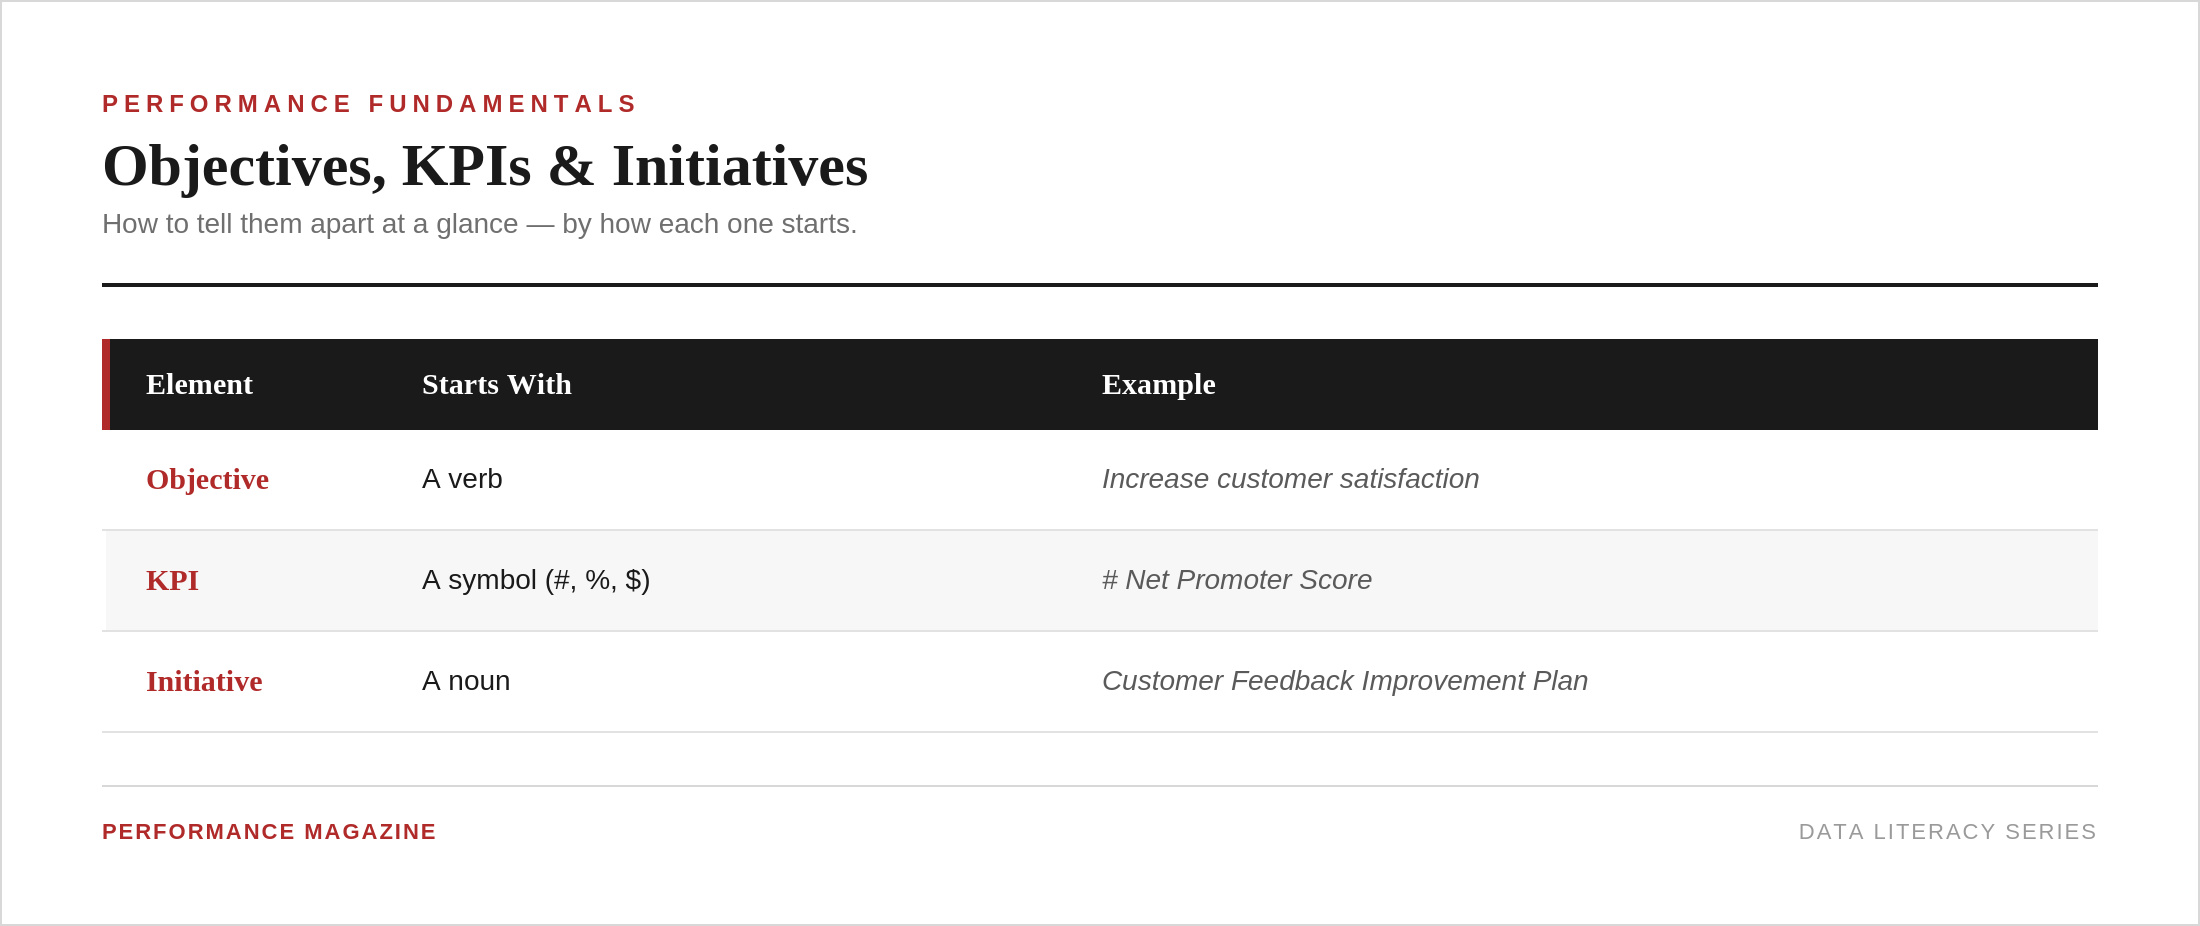
The KPI Institute recommends a consistent naming pattern that keeps objectives, KPIs, and initiatives from blurring together:
Once the objective is set, the KPI itself should meet the SMART test:
Specific: It measures one clear thing, not a vague ambition.
Measurable: The data behind it can be collected consistently.
Achievable: The target is a stretch, not a fantasy.
Relevant: It ties back to a real strategic priority, not a number that’s just easy to pull.
Time-bound: It has a reporting frequency and a deadline attached.
A KPI that fails even one of these tests tends to get ignored within a quarter.
The KPI Lifecycle
KPIs are not set-and-forget. The KPI Institute’s Body of Knowledge describes three stages every KPI moves through:
Establishment. The organization selects the KPI, documents it, and puts data collection in place.
Use. Data flows in on a regular cadence, and the KPI feeds into real decisions and reporting.
Evolution. Over time, a KPI is kept as-is, refreshed to stay relevant, suspended once it stops adding anything useful, or replaced by a more advanced measure. % Customer Satisfaction, for example, is often superseded by # Net Promoter Score as an organization matures.
Many companies skip the evolution stage, and that’s one of the most common mistakes in performance management. Plenty of organizations still track KPIs that made sense five years ago and haven’t been reviewed since.
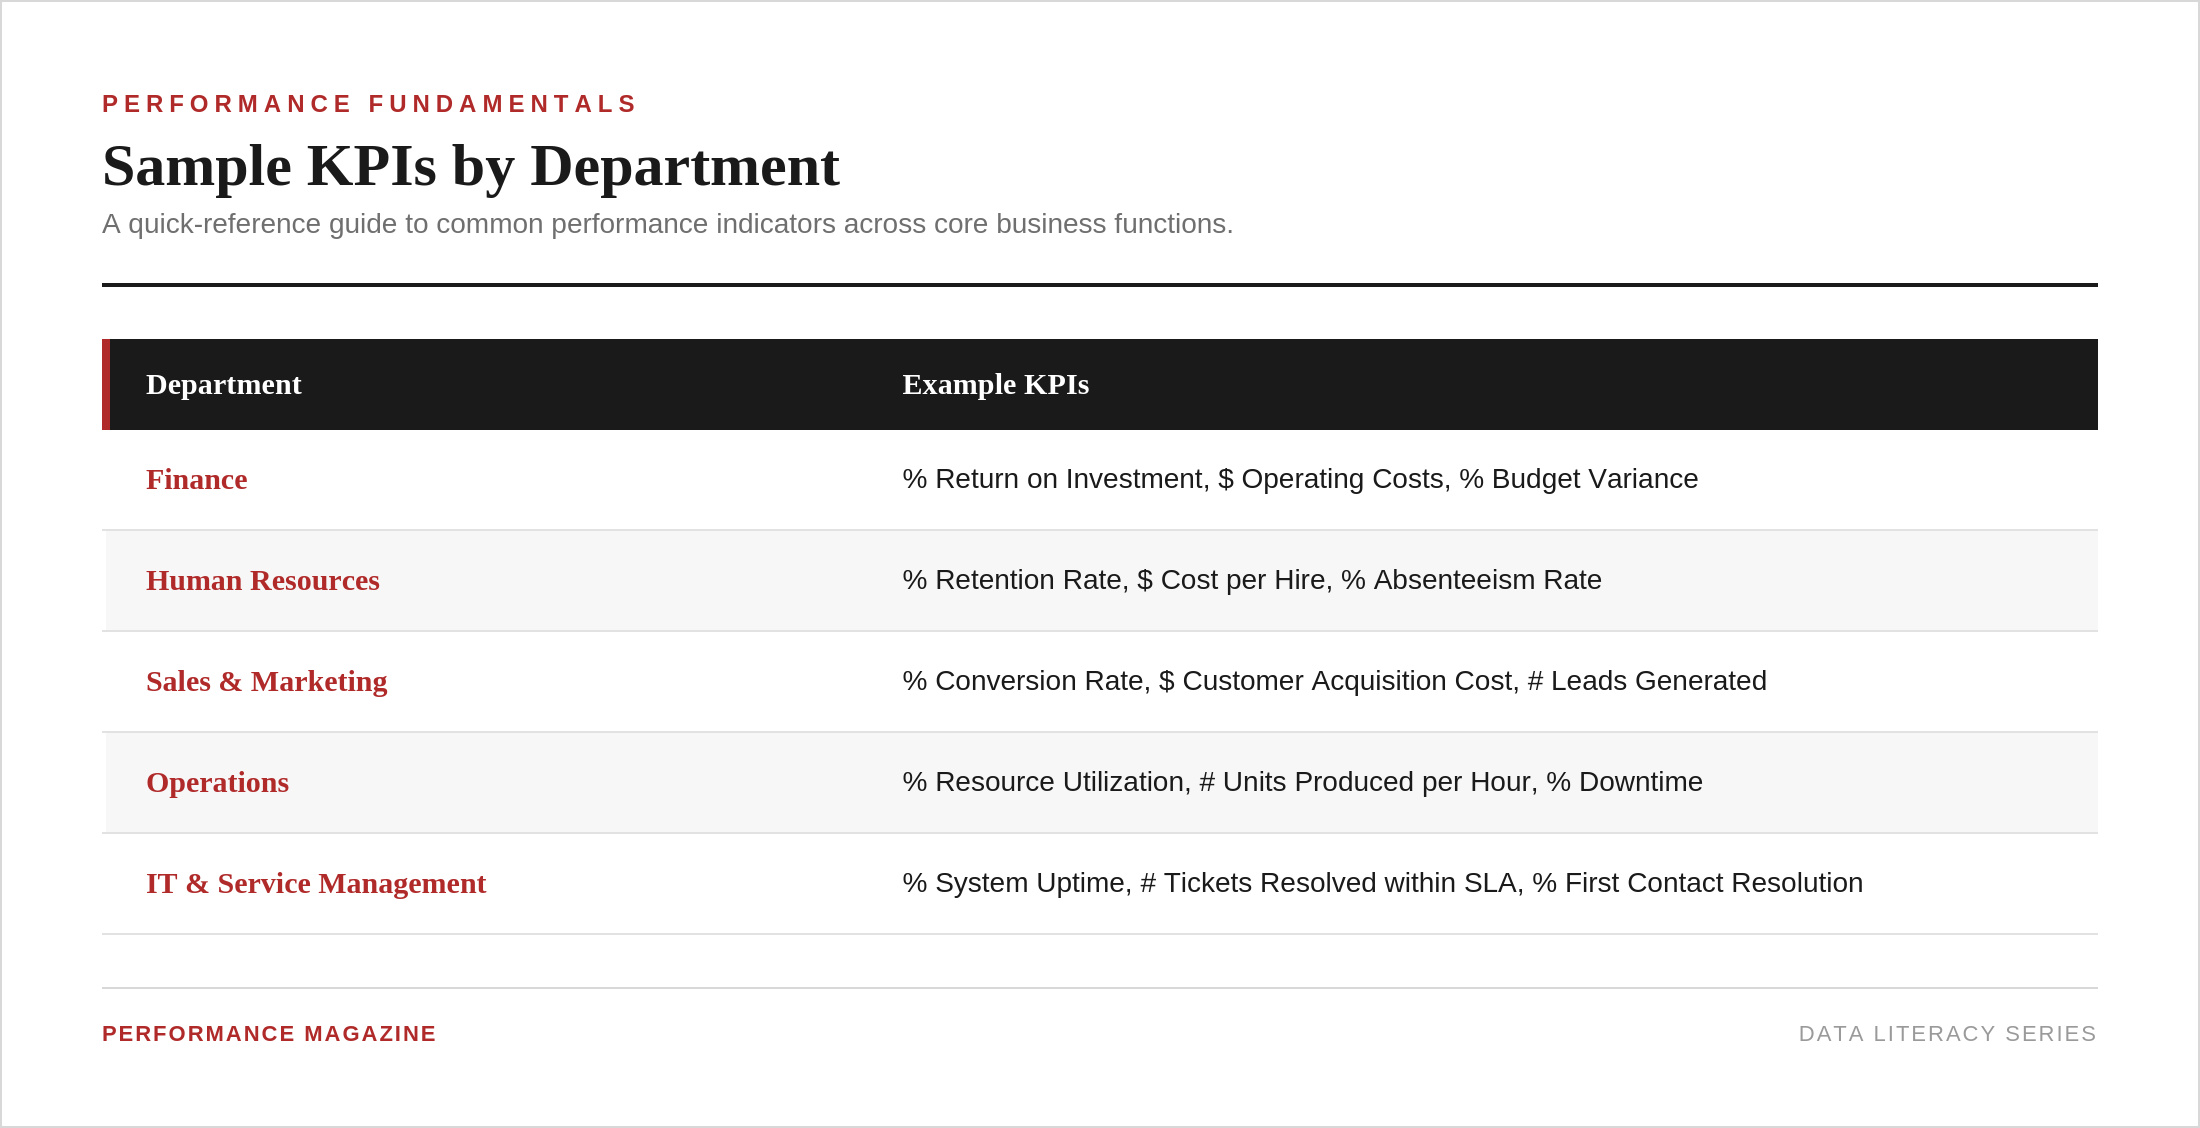
KPI Examples by Department
Most of these work best in combination rather than alone. Tracking # Tasks Completed alongside % Tasks Completed on Time and $ Value Generated per Task gives a fuller read on performance than any single number can.
Performance Measurement vs. Performance Management
These two terms get treated as synonyms, and they shouldn’t be. Neely et al. (1995) define a performance measurement system as a set of metrics used to quantify the efficiency and effectiveness of actions. Forza and Salvador (2000) go further, describing it as an information system that supports two functions: structuring communication around target setting, and collecting, processing, and delivering data on how people, processes, and business units are performing.
Performance measurement deals with the evaluation of results. Performance management deals with what happens next: the decisions, initiatives, and behavior changes built on top of that evaluation. One tracks the score. The other decides what to do about it.
The Balanced Scorecard is a good illustration of how the two ideas merge over time. Kaplan and Norton introduced it as a measurement tool in 1992. By 1996 it had grown into a strategic management system. By 2008 it sat inside a wider system for planning, execution, and organizational learning. A tool built to measure performance turned, over 16 years, into a system built to manage it.
Common KPI Mistakes
A few problems show up in nearly every organization that struggles with KPIs:
Measuring everything. Dashboards that carry 40 metrics dilute attention instead of sharpening it. A KPI list should be short enough that people remember it without looking it up.
Skipping alignment. When department KPIs aren’t linked to corporate objectives, teams end up optimizing for numbers that don’t move the business forward as a whole.
Weak documentation. A KPI without a documented formula, data source, owner, and reporting frequency is open to different interpretations by different people, and that alone can undermine trust in the number.
Stale data. A KPI that shows up weeks after the fact turns into a post-mortem rather than a tool for a live decision.
No data governance. Someone has to own data quality for each KPI, from the source system down to how often it gets refreshed. Without a named data custodian, small errors in a spreadsheet quietly turn into board-level decisions built on bad numbers.
Most of these mistakes trace back to the same root cause: a KPI system built around what’s easy to pull from an existing report, rather than what the organization actually needs to know.
Frequently Asked Questions
What does KPI stand for? KPI stands for Key Performance Indicator: a measurable value linked to a specific strategic or operational objective.
What is the difference between a KPI and a metric? A metric is any calculated figure built from raw data. A KPI is a small subset of metrics selected because it ties directly to a strategic goal and gets used by decision-makers. Every KPI is a metric, but not every metric is a KPI.
How many KPIs should an organization track? There’s no fixed number, but most performance management practitioners recommend keeping the list short, often somewhere between five and fifteen at the corporate level. More than that and the system tends to lose focus.
What makes a good KPI? A good KPI is specific, measurable, tied to a real objective, and something the organization can act on. If a KPI can’t change a decision, it’s not doing its job.
Is revenue a KPI? Revenue can be a KPI if it’s tied to a specific strategic target, such as $ Revenue Growth against a year-end goal. Without a target or an owner, it’s closer to a raw financial metric.
Who is responsible for setting KPIs in an organization? Top management sets the strategic direction and signs off on major KPIs, but the day-to-day design usually sits with a strategy or performance office, and department heads take ownership of the KPIs specific to their teams.
What is the difference between a KPI and a KRI? A KPI tracks progress toward a goal. A Key Risk Indicator (KRI) tracks the likelihood of something going wrong before it happens. Mature performance systems track both side by side.
What is the difference between a leading and a lagging KPI? A leading KPI predicts future performance, such as # Sales Pipeline Opportunities. A lagging KPI confirms a result that already happened, such as % Net Profit Margin. Leading indicators give teams time to act; lagging indicators tell them whether that action worked.
Can a KPI change over time? Yes, and it usually should. The KPI lifecycle covers exactly this: a KPI gets maintained while it’s still relevant, refreshed when its calculation needs adjusting, suspended once it stops adding anything useful, or replaced by a more advanced measure as an organization matures.
What is the difference between a KRA and a KPI? A Key Result Area (KRA) is a broad domain, such as Customer Experience or Financial Performance. It isn’t measurable by itself. A KPI is the specific, quantifiable measure placed underneath a KRA to track progress inside that domain.
Where to Go From Here
For a deeper look at any single part of KPI management, from documentation templates to lifecycle management to industry-specific examples, see:
How Can You Improve the Data Gathering Process for Your KPIs? – “An important component of performance measurement is represented by the data collection capability. However, when applied in the organizational context, this process is neither easy nor lacking obstacles, as practitioners often discover.”
How Can We Ensure Our KPIs Are Aligned With the Strategy? – “In many cases, the key performance indicators (KPIs) monitored do not seem relevant as they are not connected to the strategy. To better understand how this problem can be addressed, we must first identify its possible causes.”
How to Implement a KPI Measurement Framework – “A KPI implementation project plan provides a structure for the implementation of an organization’s performance management system. Once the project plan is set, all types of activities would have a clear deadline and designated responsibilities.”
Project Plan: Developing a Performance Management System Based on KPIs – “When formalizing and implementing a performance management system (PMS) based on key performance indicators (KPIs), there are multiple activities to be considered and many stakeholders to be engaged in the process. Therefore, you’ll need a project plan to make performance management an ongoing process within your organization.”
[Watch] KPI Selection Techniques – “Learn how KPI selection techniques can be implemented in practice and gain insights into the best practices for selecting KPIs.”
Advice on KPI Selection – “KPI selection is a process which seems simple, yet is inherently complex, due to the interdependencies involved. Here are 15 things to consider before embarking on this journey.”
[Watch] Overcoming KPI Selection Challenges: Applying KPI Selection Techniques – “What are the most important guidelines to follow when selecting KPIs for strategic objectives? What are the most efficient KPI Selection techniques, most recommended KPI selection environments, and some Value Flow Analysis technique examples?”
KPIs are not just about understanding and working with numbers. Using KPIs requires stakeholders to fulfill a vision and commit to ensuring success across all levels of their organization. If you would like to learn how to select the right KPIs for your organization, sign up for The KPI Institute’s Certified KPI Professional and Practitioner live online course today.
*********
Editor’s Note: This guide draws on The KPI Institute’s more than 20 years of research, expertise, and practical experience in performance management. Its core definitions, terminology, and frameworks are grounded in the Institute’s forthcoming KPI Body of Knowledge, developed under the leadership of Marcela Presecan, Head of Research at The KPI Institute.
“The greatest danger in performance measurement is not seeing too little, but believing you’ve finally seen everything.”
Nine KPI Lessons, One Underlying Problem
Throughout this series, we have explored what might seem like nine separate problems with measuring performance. Each article examined a different symptom, manifestation, paradox, or unexpected consequence of using KPIs to understand a complex organization. Viewed on their own, these issues seemed only loosely related. When viewed collectively, however, they tell a surprisingly coherent story.
Our journey began with the KPI Theatre, where we observed how the act of measurement changes behaviour. Once individuals know they are being observed, they instinctively begin to focus on what is visible. This is not necessarily because they are engaged in manipulation or deceit, but simply because human attention is finite and people attend to that which attracts attention. Slowly, performance shifts from being good to looking good.
Then, we examined Goodhart’s Law to see what happens when that observation becomes a target.
What began as a useful indicator of performance becomes, over time, the objective itself. People stop asking whether the organization is serving its purpose and start asking if the numbers look OK. The simple act of optimizing has quietly replaced the process of understanding.
It would seem natural that if one metric blinds you, then two will be better, but that then begets something called KPI Saturation – when everything, every function, every initiative, every strategic priority, and every operational process is represented on a dashboard.
Everything becomes so overwhelming that we are blinded by what is actually present.
Information overload has given way to attention scarcity, and when attention becomes a scarce organizational resource, metrics themselves become valuable. In The Politics of KPIs, we examined how indicators gradually evolve beyond measurement tools into instruments of influence. As dashboards grow more central to an organization’s decision-making, knowledge that is difficult to reduce to a number becomes marginalized and increasingly ignored.
Institutional knowledge, relationships, craftsmanship, intuition, judgment, and the trust required for collaboration – all fall off the strategic radar as information that cannot be easily expressed in numerical terms disappears from the conversation, as was illustrated by KPI Memory Loss.
Organizations do not necessarily fail because they lack information. Rather, they fail because certain forms of knowledge no longer receive attention, or, even worse, are actively dismissed by those who treat them as irrelevant data points. The effects of these trends, however, do not remain confined to the organization itself. The final issues that we uncovered in this series impacted the very people who were employed to deliver on those numbers.
In the KPI Identity Trap, we witnessed how those being measured can become so completely identified with the metrics by which they are assessed that they forget to ask whether they are doing worthwhile work and simply focus on what the dashboard or scorecard shows. It could be seen that the last, and perhaps most fundamental point in this series – KPI Blind Spots – is almost a natural consequence. At best, a dashboard tells us something about the reality of our situation and, at worst, it tells us an unintentional lie.
Yet the lie is never told; it simply emanates from what is left unsaid: the part of reality deliberately omitted to focus on what is believed to be most important.
Realistically, none of these were separate problems at all: behaviour, targets, information overload, politics, organizational memory, personal identity, blind spots. These are not independent phenomena, but simply different facets of the same flawed logic. A logic that proceeds on the basis that reality, as it is currently expressed in KPIs, continues to surprise us only because we have not yet measured enough.
This is what can be called the Completeness Fallacy, perhaps the most insidious belief underpinning modern performance measurement – the belief that performance (and measurement) can eventually be made complete.
Why Every Surprise Seems to Demand Another KPI
These are scenes every seasoned executive has lived out.
An unforeseen event derails a critical business process.
A major customer segment starts leaving faster than anticipated.
A manufacturing defect escapes quality control.
A major project comes in late even though all milestone flags are green.
A cyber attack bypasses the security systems that should have prevented it.
A high-performing, tenured employee quits with little notice.
The post-mortem begins, with executives staring at dashboards and data visualizations, trying to pinpoint where the red flags should have popped up and when someone should have noticed that something was going terribly wrong.
One question invariably surfaces: “Didn’t we have a KPI for this?”
Sometimes the answer is yes, and it was simply ignored. Most of the time, more frequently than many organizations are comfortable admitting, the answer is no. Thus, the logical conclusion seems obvious.
“Let’s add one.”
On its face, this is completely reasonable. Every failure is an opportunity to refine the measurement system. If an important early warning was missing, then the dashboard should be augmented to track it. It often is the right solution, truth be told.
The danger emerges when adding a new KPI becomes the default response to unexpected events, because the next time the unexpected happens (and it always does), another KPI is added. Then another and another.
The dashboards get bigger, the reports get longer, the task manager bloats, and the analytical tools become more sophisticated. Still, unexpected events persist doggedly. Each surprise seems to reinforce the idea that something else must still be missing, driving the organization toward the impossible goal of complete measurement.
This is what can be called the Completeness Fallacy.
The Completeness Fallacy is the mistaken belief that all organizational surprises stem from missing dashboard metrics and that simply adding enough KPIs will eliminate uncertainty entirely.
Complex organizations aren’t like simple machines, made of gears & cogs. They are living, breathing systems made up of people, incentives, cultures, relationships, informal networks, dynamic markets, shifting customer expectations, evolving technologies, and countless interactions that cannot be fully predicted.
Every solution creates its very own new problems. Every intervention changes the system it attempts to measure. Having a complete representation of all possible futures is impossible. Ironically, as organizations pursue completeness, they move further away from true understanding because the question asked subtly changes.
We stop asking:
“What have we misunderstood?”
Instead, we start asking:
“What KPI are we missing?”
These two questions sound similar, but there is a profound difference. The first question is about understanding and assuming that the reality of the situation is more nuanced than the dashboard’s representation. The second question focuses on measurement and suggests that the dashboard just needs an additional piece.
The Endless Expansion of the Dashboard
Think about a dashboard that includes 50 carefully chosen KPIs. A few weeks pass, and then a completely unanticipated problem arises that those 50 KPIs couldn’t have foretold.
“We need to add one more KPI!” – Leadership.
The dashboard grows to 51 KPIs. A few months later, an even greater shock arises. A new KPI is added. The dashboard now has 60. Soon 80. Then 100. Eventually, someone gets tired and asks, “If we have 100+ KPIs on our dashboard, how did this still catch us out?“
It’s a strange psychological paradox at work here.
On the one hand, leaders think “everything that is important must be on the dashboard.”
On the other hand, when something isn’t on the dashboard, it is, at least initially, discounted precisely because it is unmeasured.
Whenever reality disappoints, we try to achieve completeness by expanding the dashboard. As the dashboard grows, our confidence in it grows. That, in turn, makes the next surprise that happens all the more baffling. People begin to wonder in dismay how all of this can be happening, since they are measuring everything.
Except they are not. They never can and will never be able to. No dashboard can perfectly mirror reality; reality is always larger than its reflection.
The danger isn’t what dashboards leave out; the danger is that we forget what they have to leave out.
Babies & Video Games: Why More Doesn’t Always Mean Better
The Puzzling Perplexity of Predicting Progeny
The experience of dealing with babies is a universal (if not always enjoyable) one. Say your baby – a perfectly healthy baby, no less – is inconsolable, though not crying as a result of any obvious issue. They have been fed, cleaned, kept comfortable, and healthy, so why do the tears persist?
You hand the child a colorful toy, and for a brief moment, the wailing subsides before resurfacing with renewed vigor.
“Maybe the problem is simply that we don’t have the right toy!” and so you rush out and acquire one, only to have it achieve the same limited result. You then acquire another that sings, and another that flashes. The child continues to cry, and your resolve is steadfast: there has to be one “right” toy out there to soothe their little agitated spirits!
This process seems almost logical, and the conclusion (that another toy is just around the corner) feels almost automatic. After all, if there were a truly suitable toy, the baby would just stop crying. Right? RIGHT?
This assumption misses a crucial detail: the baby wasn’t looking for another toy at all. Maybe they simply wanted to be held, or was bored lying in one position for too long, or maybe they wanted someone to talk to them, or just to feel the comfort of their parents’ closeness. The parents didn’t need a better toy; they needed to understand the baby.
In the course of our lives, we will all learn an invaluable lesson. Sometimes the quickest, easiest path to resolution doesn’t lie in introducing a new component or finding a missing element, but in paying more attention to the subject of our concern.
Organizations are remarkably similar. Organizations often take a very different, and rather analogous, approach. Every unforeseen problem requires a new key performance indicator (KPI); every anomaly requires a new dashboard; every overlooked blind spot demands a new metric.
It’s quite possible that the problem isn’t that another metric is needed. It might be that the organization needs to better understand what it is trying to achieve in the first place. Instead of reading reports, managers might need to speak with their employees more often. Instead of filling out surveys, customers might want to talk to real humans to air their frustrations.
For example, to understand a problem in production, supervisors should walk the factory floor rather than stare at a production-tracking dashboard. While the dashboard asks, “What else can we measure?” reality is asking, “Have you truly understood me?” That distinction is at the heart of the Completeness Fallacy.
The Curious Compulsion to Continue
It plays out just as clearly in an area where organizational management can’t possibly be expected to surface: video games.
Any person who plays role-playing games or massively multiplayer online games knows that optimization quickly becomes a way of life if left unchecked. Let’s assume you load one up, make a character, and it just isn’t putting out the damage-per-second (DPS) that you were aiming for.
The logical first step, you assume, is to get a DPS meter, take some measurements, and look for the source of the deficit.
The meter tells you that you’re falling short of the damage output of everyone else on your team. You now have an answer to your problem. Or do you?
Upon inspecting your equipment, you notice that some items are suboptimal, so you immediately replace them with better ones.
You head back into the game’s content, only to see a minuscule difference in your damage output. There must be some other missing factor, something else you did not account for yet again.
You realize your equipment isn’t enchanted, and so you spend hours painstakingly applying the most potent enchantments possible.
The result is still marginal. You now invest in better gems, talent points, food buffs, consumable potions, and specialization changes. Eventually, you end up with half your screen clogged by meters tracking DPS, timers, combat logs, raid frames, cooldowns, boss warnings, and who knows what else. Still, your character’s damage output does not noticeably improve.
Add-ons are useful, but the most obvious limiting factors, such as positioning, decision-making ability, encounter awareness, or knowing when not to attack, cannot be directly measured by another number or add-on. These qualities must be learned through trial and error and by recognizing patterns. However, the more information cluttering your screen, the easier it becomes to miss the giant boss looming directly in front of you.
The Misguided Mission to Measure More
Organizations can find themselves facing this type of music in exactly the same way. The dashboards continue to grow, the reports become more elaborate, the metrics increase, and the alerts pile up, giving executives an enormous volume of information to analyze.
In practice, the actual amount of real-world understanding often advances at a far slower pace because it becomes so easy to confuse the process of measurement with actual understanding:
You can measure customer satisfaction and learn that it’s trending downwards. However, you can’t measure the sound of disappointment in a customer’s voice on a support call.
You can check a productivity dashboard, which will tell you that the project velocity has decreased, but it won’t reveal the engineer who’s afraid to challenge a deadline they know is unrealistic.
You can monitor employee morale via an engagement survey, but that can’t capture the quiet moment in the hallway, months ago, when confidence eroded just a little bit more.
You can assess sales conversion rates and identify where prospects drop off, but you can’t measure the trust that was lost in a single rushed conversation.
Wisdom doesn’t grow automatically simply from an increasing quantity of observations. Wisdom is built through an interpretation of those observations within the human context in which they occurred.
This is the true danger of the Completeness Fallacy: it persuades leaders to believe that the missing piece of the puzzle is simply another data point, and that there is never a need to stop looking at data and start listening to their people.
From Hospitals to Software: How Industries Share the Completeness Fallacy
The form in which the Completeness Fallacy shows up may vary significantly between industries, but the core principle doesn’t: whenever the world spits out an answer that surprises us, we start hunting around for some new measure, instead of asking a question: “Are we perhaps measuring the wrong thing to begin with?“
Healthcare: Measuring Patients While Missing Care
Modern hospitals amass vast quantities of data: Patient wait times, Bed capacity, Readmission rates, Length of stay, Medication adherence, ED wait times, Length of procedure, and Infection rates, among many others.
They’re all crucial metrics, but none of them fully explains why some patients with similar clinical profiles take weeks to recover while others take days. Many of the things that drive outcomes – whether the patient actually grasps what the doctor just said, has someone to nudge them about medications, or simply trusts their physician with what’s bugging them – are tough to fit into a standard spreadsheet.
We see a bad readmission outcome and naturally reach for a new quality measure. Sometimes that makes sense, but more often than not, we need to make sure the conversation was handled properly, not simply as a way to create another quality benchmark.
Manufacturing: Perfect Machines, Imperfect Systems
Manufacturing organizations usually have extremely detailed operational dashboards: Machine usage, Cycle time, Defect rates, Overall Equipment Effectiveness (OEE), Scrap rates, Downtime, or Energy usage, to name just a few.
When product quality drops inexplicably, the first reflex is often to monitor it even more closely. Very often, the mentality is “time to add another production KPI and slot in another quality check.”
Yet, investigations often find that technical issues are not at the heart of the matter; rather, the heart itself is gone.
Production targets subtly discourage the workforce from signaling minor deviations until they become significant ones.
None of these had anything to do with a lack of data regarding the machinery – these were all human systems impacting technical ones. What was needed wasn’t more sensors but a better understanding of those humans operating them.
Software Development: Measuring Productivity Without Seeing Complexity
Software teams today arguably measure more things than any team has before: Sprint velocity, Story points completed, Lead time, Cycle time, Deployment frequency, PR approvals, Bug counts, Code coverage, or Incident response time.
When the wheels are slowing unexpectedly, leadership frequently adds a new metric for engineering teams to work with.
“Maybe we need more code!”
“Maybe the reviews are taking too long!”
“Maybe the deployments aren’t happening often enough!”
Maybe the real problem might be that a legacy architecture is now extremely difficult to maintain. The team has quietly accumulated technical debt over the years and is now spending much more time understanding systems than developing features, and on top of that, cross-functional communication has broken down.
The biggest thing stopping the team from shipping may not be an absent KPI, but decades of accrued complexity that only a truly seasoned engineer can even see. Such nuance cannot be encapsulated in a dashboard.
Aviation and High-Reliability Organizations: When Safety Lives Between the Metrics
Few industries are more serious about measurement than aviation. Aircraft systems generate vast amounts of operating data, which are measured and remeasured with exceptional rigor.
Flight schedules are closely monitored.
Safety incidents are rigorously documented.
Procedures are formalized.
Performance is routinely assessed.
Nevertheless, aviation professionals know a secret that few leaders recognize: if no safety event has occurred, it doesn’t mean that safety is present.
The organization could show perfectly good safety performance on its metrics, while easily and effectively hiding its own psychological limitations regarding the issue from itself. Pilots may be unwilling to speak about hazards. Maintenance crews might be reluctant to acknowledge near-miss events because they might feel embarrassed or appear incompetent. A Junior team member might have no idea how the process could be made safe and would have no incentive to raise such concerns.
The overall safety indicators might be beautifully and blissfully green right up to the day of a disaster. When such a disaster occurs, the investigators rarely attribute the failure to a single additional KPI or a particular missing index or tool. Instead, they generally attribute the disaster to communication failures or human errors that may have predated the measurement systems.
The organization didn’t lack yet another metric – it lacked a deeper understanding of the system it thought it had measured.
In all 4 of the industries we’ve showcased, the situation repeated itself:
Disasters occurred
Organizations assumed they must be missing a metric
The metrics were expanded
They were surprised again and again
Such scenarios don’t happen because leaders lack the intelligence to be able to design and implement appropriate measurements, but because no complex system, as a matter of principle, can ever be as large as its own representations of itself. No dashboard can become the entity being measured.
When organizations reach that stage, they focus so intently on measurement devices that they neglect the journey and miss where they are going.
Final Thoughts
Looking Through the Windshield Instead of at the Dashboard
Never before has there been so much readily accessible operational information available. Never before has there been a way to see performance across continents in real-time, spot emerging trends within minutes, or turn vast amounts of raw data into simple, intuitive pictures. Organizations have become faster, more coordinated, better informed, and ultimately, more agile.
Problems arise only when dashboards stop being tools for understanding and start becoming substitutes for it. This is, ultimately, what’s dubbed the Completeness Fallacy.
It has nothing to do with whether KPIs are useful or useless, or whether measurement systems need upkeep or not. Rather, it is the false belief that uncertainty can eventually be engineered out of the organization by judiciously selecting enough indicators.
In modern-day organizations, every KPI answers one question but begs another. Every bit of extra visibility alters behaviour, thereby changing what the measurement actually means. Performance measurement isn’t a race towards a state of completeness. It’s a never-ending conversation between what can be measured and what requires only observation, judgment, curiosity, and experience.
Dashboards are the thing that should inform a conversation, never replace it. Think of them as a car windshield. It has never been designed to capture every detail of the road ahead. It won’t reveal what is hiding behind every building, nor will it show every hidden pitfall lurking around the bend. Its purpose is to provide just enough visibility to help us navigate while, at the same time, reminding us that the road itself deserves our attention.
Modern performance dashboards have precisely the same role. They are not the organization, but the windows through which we may view organizations in a richer, more dynamic manner than any collection of KPIs can adequately convey.
If we start to look at the windshield instead of through it, we are liable to lose sight of where we are going, and that may well be the most profound irony of modern performance management:
We have never measured more, and with better tools. At the same time, we have never depended more on the interpretation, conversation, experience, and context provided by the people powering the soul of our workplaces.
*********
Looking to strengthen your expertise in KPI design and performance measurement? Gain practical knowledge, proven methodologies, and globally recognized certification through The KPI Institute’s Online Certified KPI Professional.