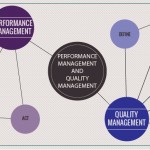
Performance Measurement taxonomy – linking Performance Measurement and Management
smartKPIs.com Performance Architect update 15/2010
In my previous update, I discussed the concept of taxonomy and outlined the structure of a Performance Management taxonomy. A subset of Performance Management is Performance Measurement and thus a separate taxonomy is required to illustrate its key elements.
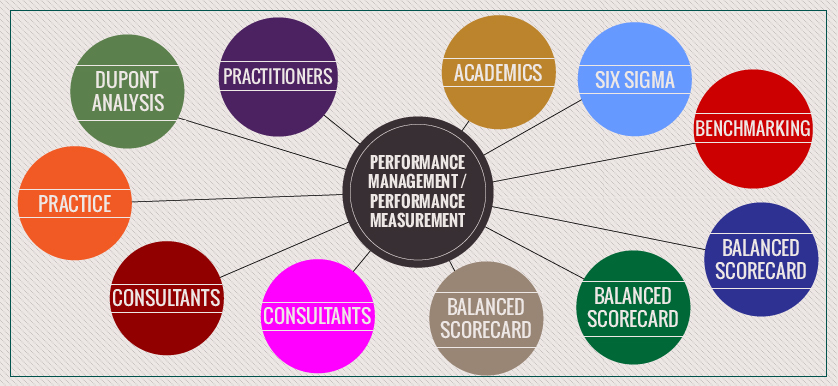
The Performance Measurement taxonomy outlined below starts with a list of Performance Measurement instruments that provide the link with the Performance Management taxonomy. The other elements illustrate the various descriptors of performance measures.
The taxonomy is listed in a linear format, as it is still work in progress. A more complex map of the taxonomy can be structured once it matures:
Performance Measurement
Instruments
- Goals / Objectives
- Measures
- Performance indicators / metrics
- Key Performance Indicators
- smartKPIs
- Scorecards
- Dashboards
Stakeholders
- Measure owner
- Data custodian
Dimensions
- Cost
- Time
- Quality
- Maturity
Measure unit type
- $ Value
- # Number
- % Percentage
Formula type
- Average
- Volume
- Rate
- Ratio
- Index
- Composition
Measurement type
- Quantitative
- Qualitative
Measurement focus
- Risk
- Satisfaction
- Money
- Quality
- Duration
- Volume
Measure relevance level
- Strategic
- Operational
Positive trend for measurement results
- When increasing
- When decreasing
- When within an interval of values
Indicator focus
- Leading
- Lagging
- Diagnostic
Measure impact stage
- Input
- Process
- Output
- Outcome
Data capture period
- Spot
- Day
- Week
- Month
- Quarter
- Year
- Year to date
- Rolling average
Listing and grouping such elements is a good first step. Exploring the relationships between them and linking them in a map structure will provide a much richer picture.
Stay smart! Enjoy smartKPIs.com!
Aurel Brudan
Performance Architect,
www.smartKPIs.com

Tags: Aurel Brudan, Performance Architect Update, Stakeholders, Taxonomy