Measuring advertising performance: a recommended set of 8 media metrics
As part of the promotion mix in marketing, advertising is one of the most dynamic and costly promotional activity. Although declined with about 2,6 % by comparison to the previous year, the U.S. advertising expenditure has still been above $ 130 billion dollars in 2008 (according to a The Nielsen Company report).
Performance management in advertising focuses on various levels, from research and planning the advertising campaign, to implementation and results assessment. Herein, when choosing the appropriate media for message deployment, several media metrics ought to be tracked in order to have an accurate view of the expected coverage and impact of the media program.
For a complete assessment of the media chosen, the most popular media metrics used in advertising are the following:
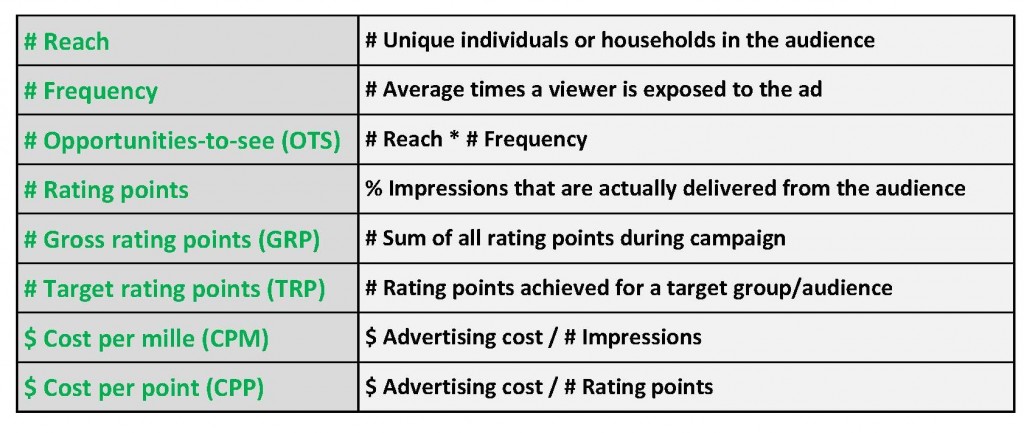
- Begin with the estimation of the # Advertising reach. Reach is the volume of the audience to whom the communication is directed. However, reach does not indicate the number of individuals or household the ad will actually be exposed to, it only reflects the potential actual exposure considering the number of households that have access to that media.
- For the individuals or the households that form the # Reach, calculate the average number of times they are exposed to the advertisement. You will then obtain the # Frequency metric.
- Having estimated # Reach and # Frequency, you can now calculate the # Opportunities-to-see, as the result of # Reach multiplied to # Frequency. # OTS is also called # Impressions and it reflects the total number of ad exposures as a function of unique individuals exposed and the number of times each individual has the chance to see the ad. In audio media, the # OTS is equivalent to # Opportunities-to-hear, reflecting the total number of ad exposures as a result of individuals exposed multiplied to average chances to hear.
- Further on, extracting from the total available impressions the percentage that is actually delivered by the media vehicle generates the # Rating points. One rating point means that one percent of the audience actually sees the ad.
- Adding up all rating points during campaign will result in the # Gross rating points, this measuring the total exposure the ad receives. However, if the ad is broadcast in a show with 10 rating points and also in one with 15 rating points, it does not mean that 25 % of the audience sees it because some viewers may see it both times.
- If the ad targets a particular group in the audience for that media (i.e women under 35 years), you will then use # Target rating points, which is the rating points considered for that particular group in the audience.
- Finally, after having quantified the audience, you will have to calculate your costs in order to make a decision of what media and show to choose for ad deployment. The metrics most commonly used is the $ Cost per mille (CPM), also called $ Cost per thousand, which is the cost to reach 1000 impressions. For calculation, you will have to divide the ad campaign cost to the number of impressions generated.
- In relation to $ Cost per mille, advertisers can also use the $ Cost per point (CPP), that equals the advertising cost divided to the number of rating points achieved.
To sum up, we have the following ad metrics:
For further Key Performance Indicator examples used in advertising practice, you can visit the smartKPIs.com KPIs in Advertising page.
A particular set of ad metrics refer to social media performance management, an area with an outstanding dynamic. Stay tuned on smartKPIs.com blog for a future post on social media metrics.
References:
- Faris et al. (2006), Marketing Metrics: 50+ Metrics Every Executive Should Master, Wharton School Publishing, Upper Sadle River New Jersey.
- „U.S. Ad Spending Fell 2.6% in 2008, Nielsen Reports”
Image Source:

Tags: Advertising performance, Key Performance Indicators, Marketing performance, Metrics, Performance Management


