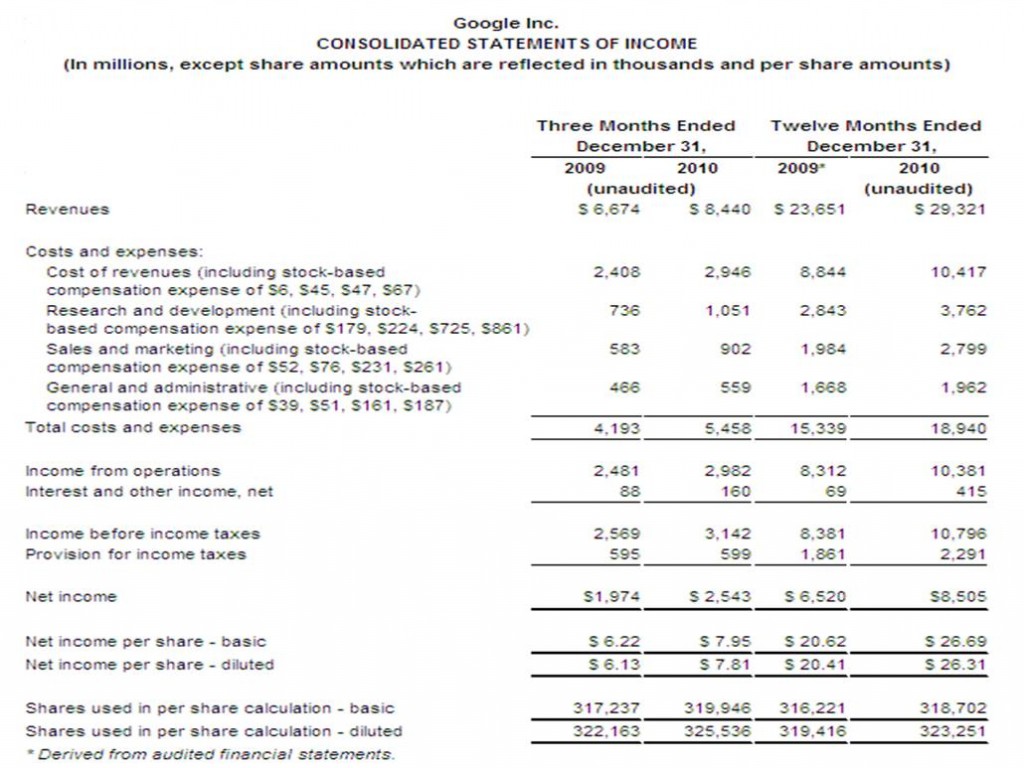
Google KPIs – Q4 2010 financial performance results
Google Inc. recently announced the financial results from Q4 2010, reporting revenues of $8.44 billion, a 26% growth compared to Q4 2009.
The financial Key Performance Indicators (KPIs) highlighted in the press release are:
- $ Revenues: revenues of $8.44 billion in the fourth quarter of 2010, representing a 26% increase over fourth quarter 2009 revenues of $6.67 billion
- $ Google sites revenues: Sites owned by Google generated revenues of $5.67 billion, or 67% of total revenues, representing a 28% growth over fourth quarter 2009 revenues of $4.42 billion.
- $ Google network revenues: Google’s partner sites generated revenues, through AdSense programs, of $2.50 billion, or 30% of total revenues, representing a 22% increase from fourth quarter 2009 network revenues of $2.04 billion.
- $ International revenues: $4.38 billion, representing 52% of total revenues in the fourth quarter of 2010, compared to 53% in the fourth quarter of 2009.
- $ Paid clicks: Aggregate paid clicks revenue with increased 18% over the fourth quarter of 2009.
- $ Cost per click: Average cost-per-click, which includes clicks related to ads served on Google sites and the sites of our AdSense partners, increased approximately 5% over the fourth quarter of 2009.
- $ Traffic Acquisition Costs (TAC): Revenues shared with Google’s partners, increased to $2.07 billion in the fourth quarter of 2010, compared to TAC of $1.72 billion in the fourth quarter of 2009.
- $ Stock Based Compensation (SBC): $396 million, compared to $276 million in the fourth quarter of 2009.
- $ Operating expenses: $2.51 billion, representing 30% of revenues.
- $ Operating income: $2.98 billion, representing 35% of revenues.
- $ Income taxes: Effective tax rate was 19%.
- $ Net income: $2.54 billion, compared to $1.97 billion in the fourth quarter of 2009.
- $ Cash flow and capital expenditures: Net cash provided by operating activities in the fourth quarter of 2010 totaled $3.53 billion, compared to $2.73 billion in the fourth quarter of 2009.
- $ Cash: $35 billion.
- # Headcount: 24.400 employees (Google Inc., 2011).
“Q4 marked a terrific end to a stellar year“, said Eric Schmidt, CEO of Google. “Our strong performance has been driven by a rapidly growing digital economy, continuous product innovation that benefits both users and advertisers, and by the extraordinary momentum of our newer businesses, such as display and mobile. These results give us the optimism and confidence to invest heavily in future growth — investments that will benefit our users, Google and the wider web.” (Google Inc., 2011)
For more information, a live audio webcast of Google’s fourth quarter and fiscal year 2010 earnings release is now available online.
For more examples of KPIs in practice reports reflecting financial performance , visit the Finance KPIs and Accounting KPIs sections.
References:
- Google Inc. (2011), Google Announces Fourth Quarter and Fiscal Year 2010 Results and Management Changes
- GoogleIR (2011), Q4 2010 Earnings Call
Photo Source:
- www.cugetliber.ro
- Google Inc. (2011)
Video Source: GoogleIR (2011)

Tags: Google, KPI, KPI in Practice, Report Analysis


