Monitoring ethnic representation in UK universities

Recently launched report ‘Race into Higher Education’ presents a comprehensive review of current ethnic minorities in higher education. Based on detailed analysis of both the Office of National Statistics’ Labour Force Survey and the Higher Education Statistics Agency’s ‘HESA Student Record’, the report offers a support for the Government policy makers, university boards and UK industry, to see how the current ethnically diverse generation will affect tomorrow’s workforce.
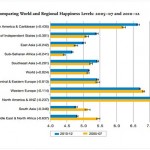
According to the report, ethnic minority groups are better represented in UK universities than in the general population. Almost one in six (16.0%) of UK university students are from a Black Asian and Minority Ethnic (BAME) background. This is up from 8.3% in 1995-96, the year in which Business in the Community founded Race for Opportunity. This increase is virtually in line with the growth in the BAME population from 7.7% of 18 to 24 year olds in 1995-96 up to 14% in 2007-08. (Business in the Community, 2010)
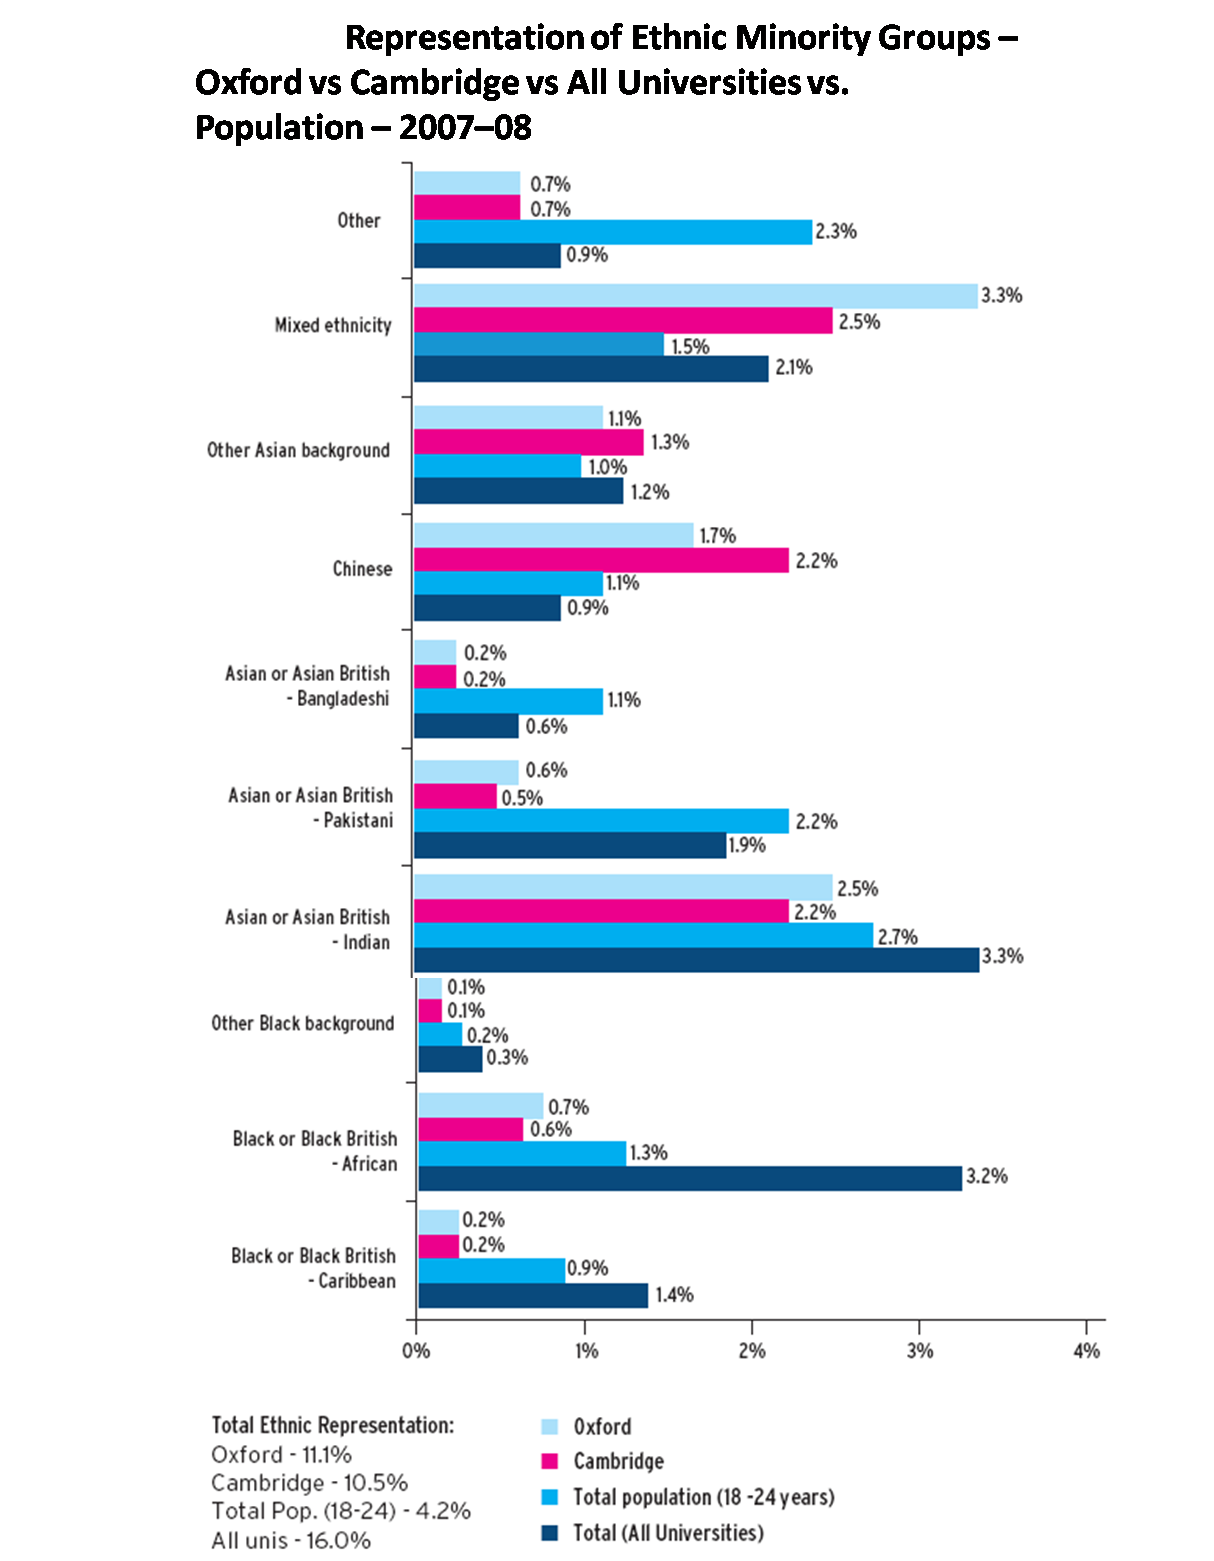
British Indians continue to be the best represented ethnic minority group within UK universities in 2007-08 (3.3%) as they were in 1995-96 (2.1%). They were followed by Black or Black British Africans (3.2%) who have almost tripled their university presence in the last 12 years, and finally, mixed ethnicity students constituted 2.1% of the university population. (Business in the Community, 2010)
The “Race into Higher Education” report presents the UK’s elite universities, regarding the students from ethnic minorities: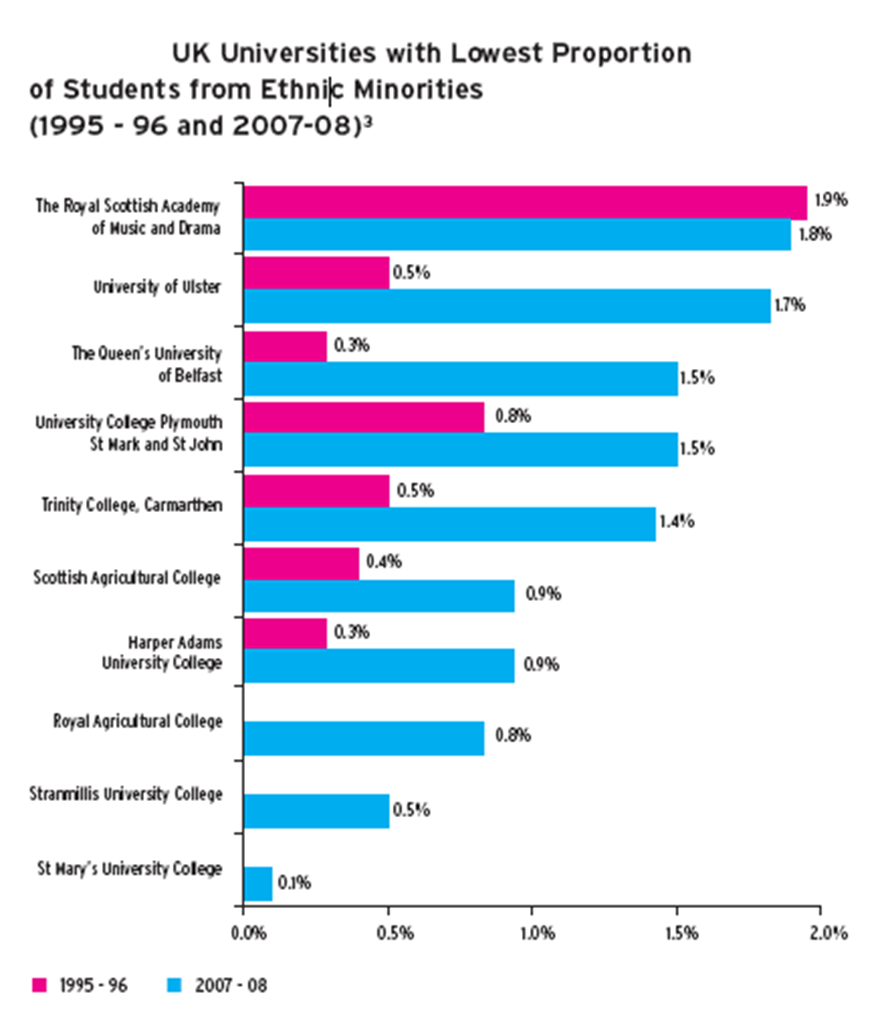
Oxford and Cambridge recruit fewer ethnic minority students than the average for all other universities. However, the situation is different from one ethnic minority group to another.
The main performance indicator used within this report is % Ethnic minority students.
The report is available free of charge at: http://www.bitc.org.uk/workplace/diversity_and_inclusion/race/hesa_report.html
Additional resource:
Reference:
- Business in the Community (2010), “Race into Higher Education”, UK
- Photo Source: Business in the Community, 2010

Tags: Higher Education Statistics Agency, Office of National Statistics’ Labour Force, Oxford, Performance in UK, Report Analysis