Governmental Performance – The Illinois Department of Public Health

Reporting governmental performance is not a novelty anymore. States have understood that future development can only be based on monitoring and improving the present actions.
The State of Illinois is no exception. It has developed a reporting system aimed at assessing the performance of all governmental agencies. The Illinois Performance Reporting System (IPRS) is coordinated by the Governor’s Office of Management and Budget, responsible for analyzing state agency programs and budgets, allocating resources and measuring any progress achieved. The areas monitored range from education and health, to social services and public assistance, debt management, public safety and the environment. Another government with highly visible performance improvement results is the Namibian one, which has just implemented contracts for all ministries. You can read more on that in this article.
In what follows, one can review the performance results for the Department Of Public Health. The structure of the report is the same for all agencies, which facilitates comparison across agencies.
The Illinois Department of Public Health has as its mission to promote the health of citizens through the prevention and control of diseases and injury. To achieve its goal, the department is actively involved in setting standards for hospital and nursing home care, in checking the safety of recreation areas or the quality of the food, by inspecting farms and plants. This constant preoccupation for safeguarding citizens’ health is also shown by the various programs undertaken recent years.
The most recent performance report shows the 2014 and 2015 results, as well as the 2016 targets. For each of the programs rolled out, an in-depth description is available, to serve as a presentation for the outcomes generated.
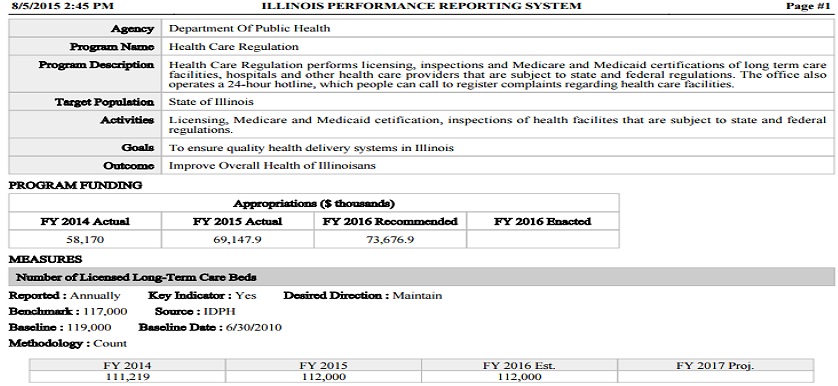
The structure of the report describing one of these programs is available below:

Highlights of the reports:
- It states both the name of the program and the agency undertaking it;
- The program’s description, thus providing a better understanding of what it strives to achieve;
- The activities that are going to take place during the project are referenced, in order to identify the steps needed to be followed, so as to ensure a proper project deployment;
- The target population and goals addressed by the program are mentioned as well;
- The outcomes expected at the completion date. Thus, it is clear from the beginning what are the benefits of the project, to whom they are addressed and which steps need to be followed to ensure its successful deployment.
- The next part of the performance report refers to the financial resources needed for this project. It provides details about the funds allocated in the previous and current year, as well as a projection for the next one.
- The last part of the report contains information in regards to the KPIs used to measure the success rate of this project. In the example provided, the indicator used to track the progress of the initiative is “# Licensed long-term care beds.” Besides the name of the KPI, other important fields are used to better comprehend how the KPI is calculated, how often it is reported and what is its target.
For the KPI mentioned above # Licensed long-term care beds, the reporting frequency is annual, which means that the indicator is reviewed only once a year and the trend should be maintained just the same.
Moreover, a benchmarking level of 117,000 is provided for # Licensed long-term care beds. The benchmarked data source is either a national organization, a near-peer state agency or a specific source for the established best practice.
In addition, the baseline, referring to the earliest data registered for the KPI, is also mentioned as being as early as 2010. The methodology explains how the KPI is calculated, which are the previous results, current results and any future predictions.
This performance report format is similar to a Documentation Form, but with the added benefit of having embedded results. It covers categories for both an Initiative Documentation Form and a KPI Documentation Form, but with performance data attached.
Having such a format for all running programs across governmental agencies aids in understanding the initiatives taking place at state level, their impact and the financial resources needed to be allocated. This way, the government can better distribute budgets, easily assess the initiatives that led to desired outputs, and take corrective actions for the ones that did not achieve their goals.
- Image source: Pixabay
- Image source: Office of Management and Budget (2015), Agency performance metrics report: Department of Public Health

Tags: Government performance, Performance in USA, Performance Management System


