Organizational processes should be designed in such a way that they effectively enable the strategic implementation of corporate objectives. Successful execution of strategy demands well execution of processes from all perspectives.
Processes that are properly understood and deeply rooted in the organizational realities will produce results that are reliable, easily controlled, and effectively managed. The documentation of processes allows for meticulous work to be conducted in relation to a company’s effort of architecting process frameworks and solutions.
Moreover, process documentation is intended to accurately describe the landscape of a process, the activities included within that landscape, the standardized workflow associated with a particular process, and its current state by comparison with a desired one. Process templates generally reflect on the degree of process documentation within an organization.
“Process templates are created to describe some aspect of a process, a process landscape, process flow, process solution or state. […] Process templates enable the capture and relation of process-centric objects within the same template or across multiple templates, each of which promotes its own view of a process.” (Von Rosing, Von Scheel, & Scheer, 2014, pp. 175-180)
With decomposing processes into KPIs, proper documentation that involves process description and the internal procedures should be in place. Meanwhile, process management tools such as process maps are consulted for a better perspective on the process itself.
The basic process management tools and templates that can be used for an effective process design are the following:
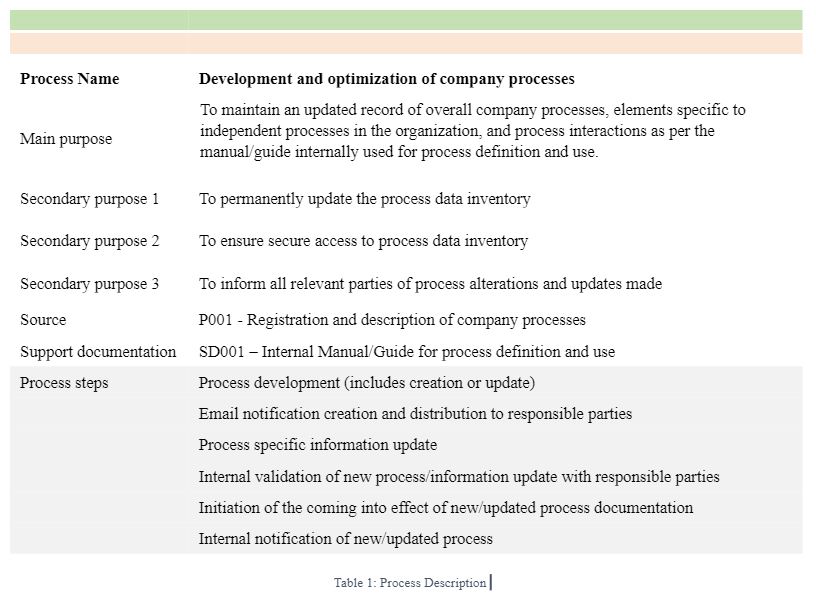
1. Process description: The process description is a template that supports the organization in understanding the functionality of each process in turn. It is vital that the process description concentrates on the purpose of the process as a constituent part of operational activity rather than the steps in the process.
The purpose of the process becomes a focal point around which processes are defined. This is especially important due to the fact that processes around which the company is currently organized may not be the most suitable for strategy. It is not excluded that the process description includes more than one purpose for a process in place.
Purposes can be main or secondary. The main purpose refers to the strategic purpose that the process serves for the organization. Secondary purposes are the ones that are directly tied to the main purpose of the process; however, they have a more functional or operational focus that generally derives from the process steps or activities.
Such a way of working with the process description not only helps to validate the linkage to organizational objectives but also leads to a more accurate distribution of KPIs. This will be measured by levels of organizational performance.
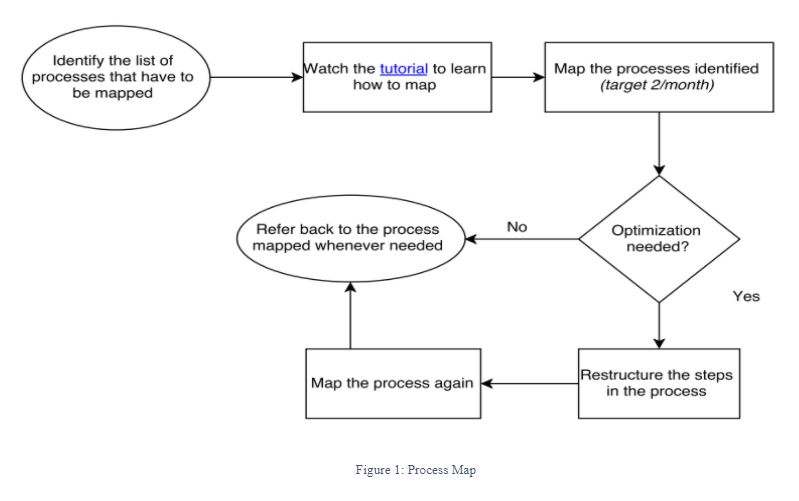
2. Process map:The process map is a process management tool “that shows input-output relationships among process dependent operations and departments and that documents in a step-by-step process sequence the activities that are required to convert inputs to outputs for the specific process.” (Hunt, 1996, pp. 8-10)
A process map provides an illustration of organizational processes as well as the interactions between the main process steps. A process map is especially important as it helps identify the main inputs stepping into the process and the main outputs stepping out of the process, while reflecting on the “as is” or” current state” of the process itself.
One of the most important roles of the process map is it helps identify bottlenecks in the process or waste that needs to be eliminated in order for the company to achieve process optimization.
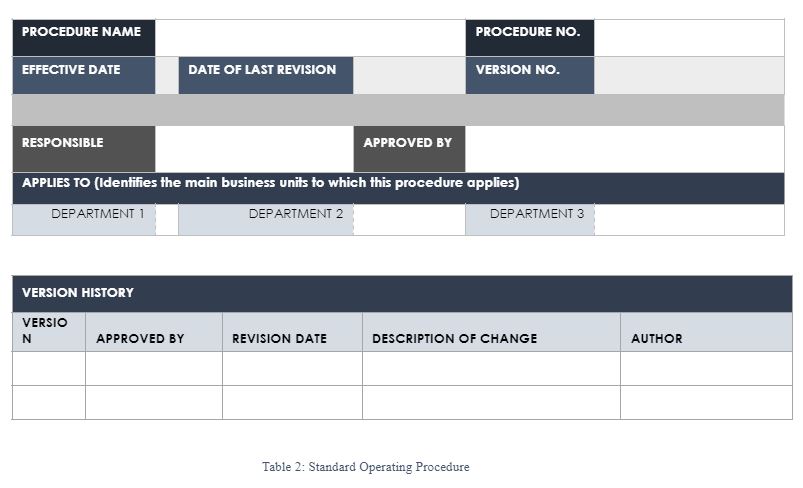
3. Internal procedures:Internal procedures are a necessary tool in breaking down processes into KPIs and process optimization thereon forward. They also deliver a standardized template for capturing specific process information.
Internal procedures provide a more detailed view of how processes are conducted for the organization as well as the Service Level Agreements instituted as part of the interactions with other processes in the organization.
Internal procedures also provide a set of detailed steps on how to perform process tasks, which significantly aid process performance measurement through KPIs.
Those basic process management tools and templates provide a simple and cost-effective solution to breaking down processes into KPIs. If used effectively, they can deliver tremendous benefits, such as preservation of process knowledge, documentary evidence of process understanding, a framework for process performance measurement, and overall improvement of business processes over time.
When formalizing and implementing a performance management system (PMS) based on key performance indicators (KPIs), there are multiple activities to be considered and many stakeholders to be engaged in the process. Therefore, you’ll need a project plan to make performance management an ongoing process within your organization.
What matters most is not to have an extra process in place, but to do it right by connecting strategy formulation with strategy implementation and KPI across the organizational levels. The way you will design and implement the PMS based on KPIs will play a huge role in the way it will be perceived by the employees. This is exactly why our approach is based on a combination of analysis and research, workshops and feedback activities.
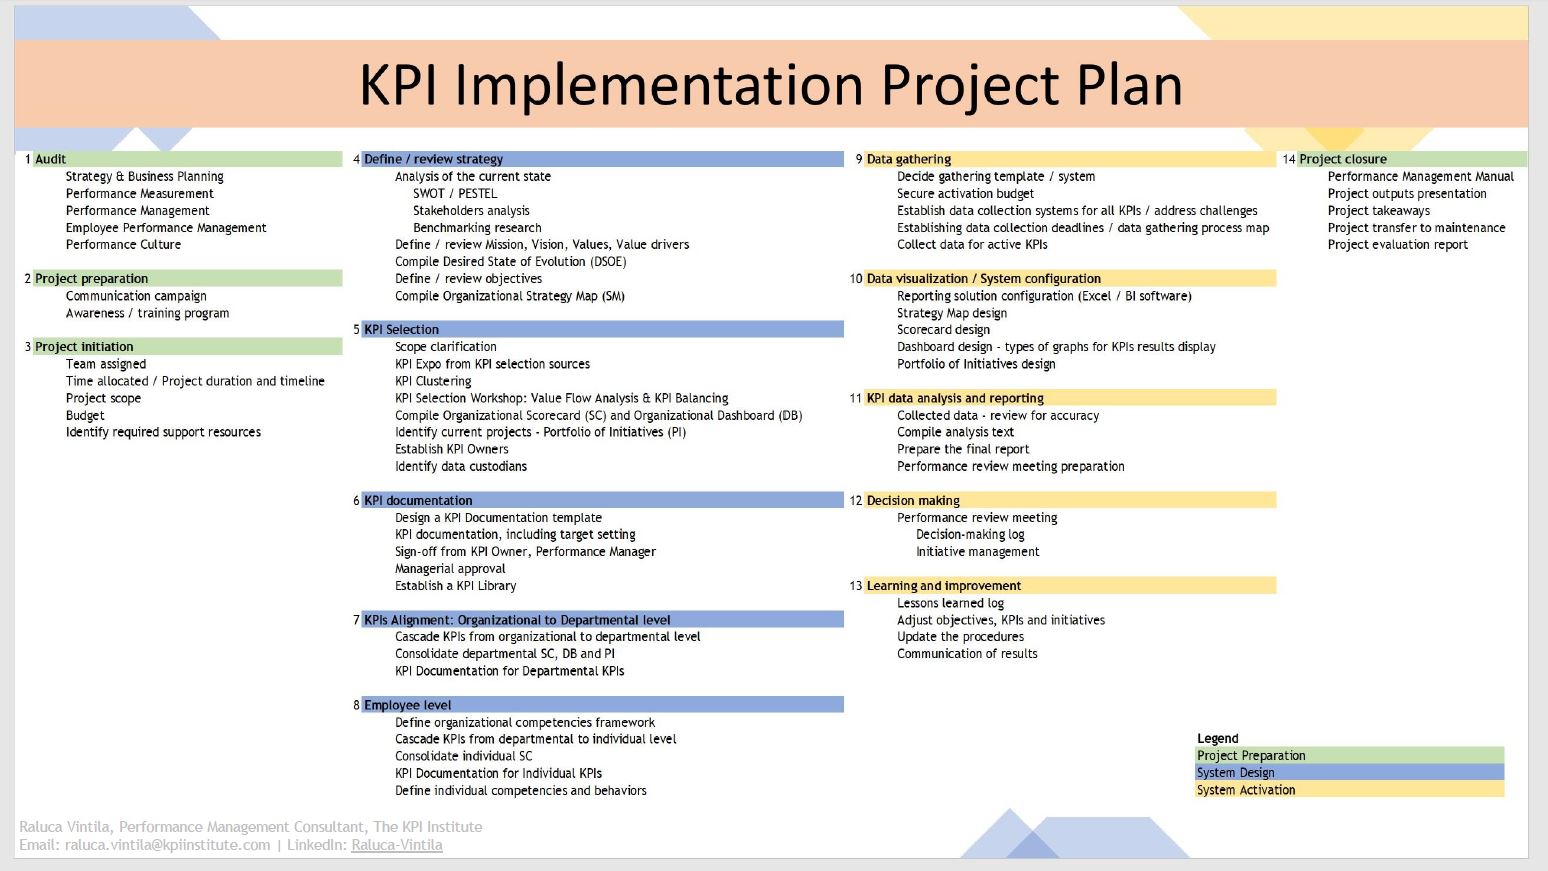
Zooming out, the proposed project plan includes 14 stages:
5 Stages: System Design
5 Stages: System Activation
4 Stages: Project Management
Zooming in, all 14 stages include major sub activities that indicate how granular this puzzle can be. A real image of efforts and resources engaged.
What are the key elements to ensure that a KPI implementation project plan will be a success story?
The differentiator in creating successful conditions is represented by the employees’ trust in the project. Why? Because change brings fear, and fear must be managed in connection to the implementation of KPIs.
Fear of becoming replaceable or unnecessary
Fear of unrealistic (too high) targets
Fear of extra work
As what I wrote in a previous article, if fears exist, then managers should consider looking for a course, training, or coaching session on how to guide their employees in managing their fears. Another step is to have an organizational message with a system that reinforces the organizational culture and the real intentions and effects of such a project, reassuring everyone that they will not be swept away by it.
Could this project be considered for departmental level only?
The KPI implementation project plan can be applied to the departmental level only. It has advantages and disadvantages Since this KPIs system is not a stand alone, the departmental level will ultimately get connected to the strategic (superior) and individual level (lower).
One advantage of this approach is the system will be founded on a strong understanding of operations and specific processes and developed at departmental (mid) level. Another advantage is increased involvement of employees in developing the system. This can generate a high sense of commitment and engagement based on their contribution.
Meanwhile, the disadvantage of this approach is that starting with the lowest level may not ensure a strategic orientation, and it may be predominantly narrow instead, given the limited understanding of the overall organization’s mid- and long-term commitments.
If you would like to learn more about KPI measurement and KPI implementation, sign up for The KPI Institute’s Certified Professional and Practitioner training course.
How does cascading KPIs to the individual level look like?
Performance management as a practice facilitates the long-term success of an organization, as it brings focus and clearly defines the organization’s identity and strategy, while ensuring resources are allocated towards what matters.
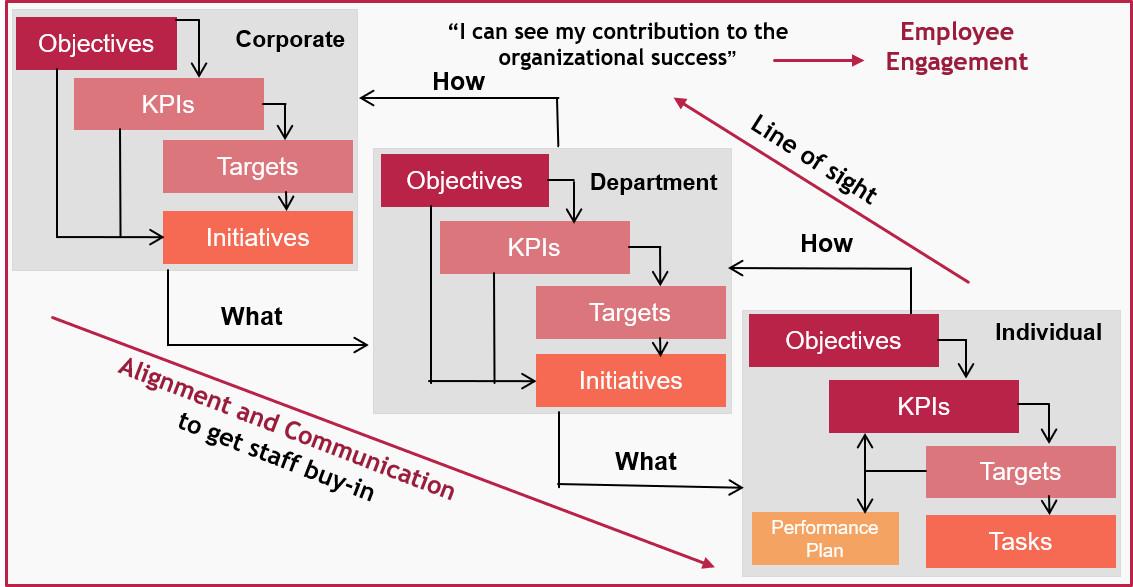
A structured performance management system enables alignment from the organization’s strategic direction towards its departmental key functions and individual priorities.
It ensures that strategic objectives are executed across all units and functions, while establishing relevant KPIs at each level of the entity. The cascading technique addresses the challenge of working in silos and drives cross-functionality and uniformity.
How do we cascade operational strategy to individual level?
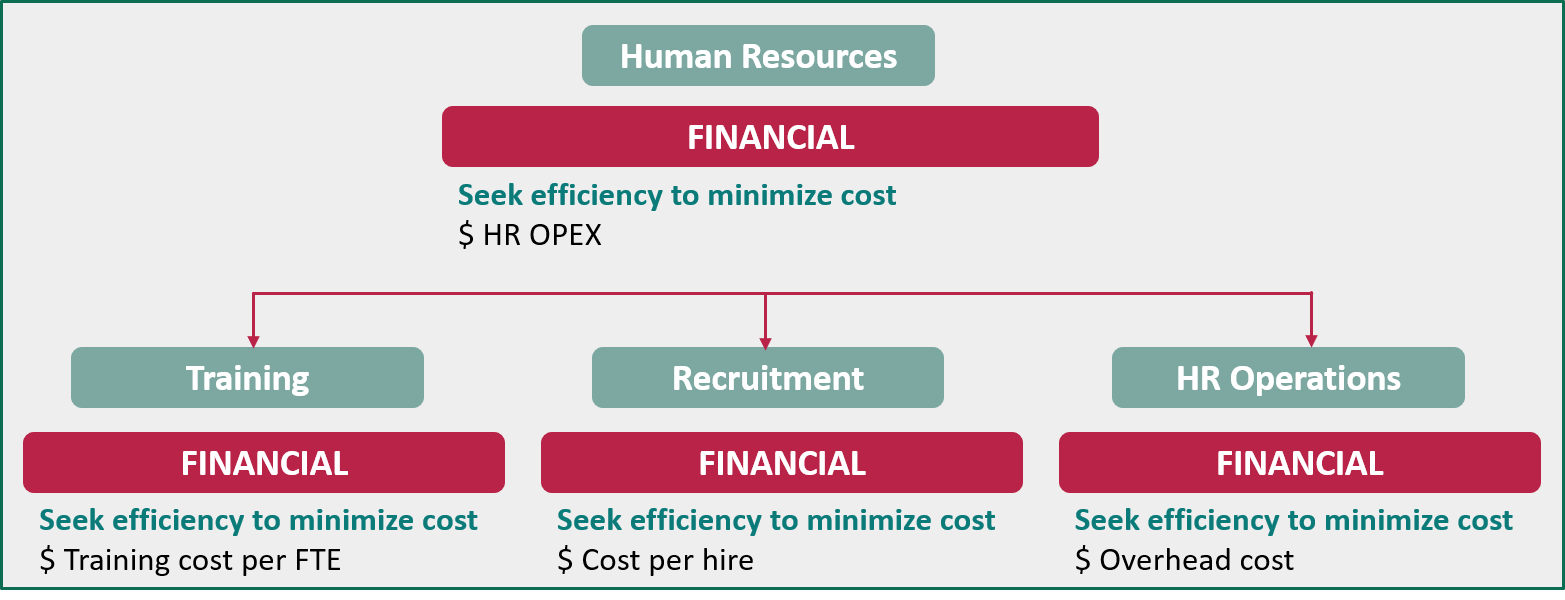
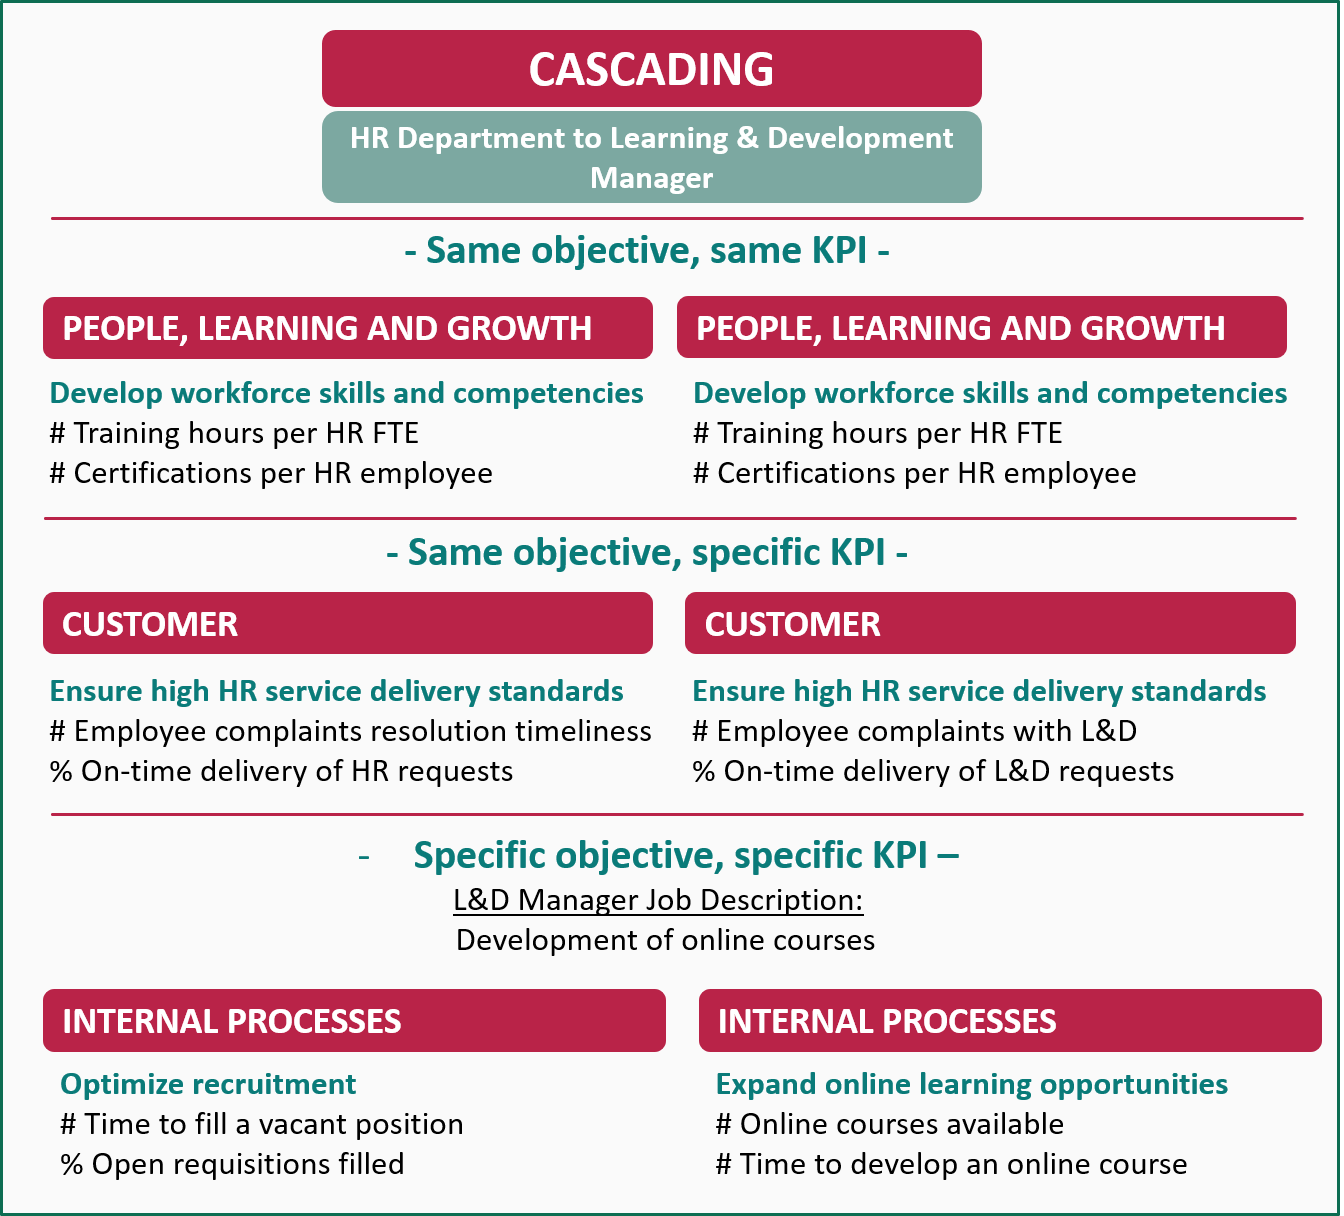
Let`s take a look at an example of an HR Department.
First, the same objective can be cascaded to multiple functions, each of them measuring it through different KPIs.
Second, department level objectives and KPIs can be cascaded and aligned at individual level either as they are, with the same or different KPIs:
Same objectives – same KPIs;
Same objective – specific KPIs.
Finally, some departmental objectives may not be applicable to cascade to lower levels; however, we can add specific objectives and KPIs based on the targeted employee’s job description.
SMART objectives
In terms of the quality of objectives, organizations must focus on developing SMART ones.
The SMART acronym is one of the most used phrases in business. It has its origins in the Goal Setting Theory school of thought and the Management by Objectives concept. The latter was introduced and popularized by Peter Drucker in 1954 through his book “The Practice of Management”. This approach aims to improve organizational performance by clearly setting and defining objectives/ goals agreed by both management and their employees.
Back in 1968, Dr. Edwin Locke published “Toward a theory of task motivation and incentives,” where he investigates the premise that conscious goals affect actions. His research and conclusions lead to four general principles designed to motivate and lead to best performance:
Goals should be challenging, however attainable.
Goals should be specific rather than vague
Employees should be part of the process of setting their own goals
Goals should be measurable and clearly understood
George T. Doran published a paper in 1981 called: “There’s a S.M.A.R.T. Way to Write Management’s Goals and Objectives.” Based on his proposal, a SMART objective should meet the following criteria:
Specific – target a specific area for improvement
Measurable – quantify or at least suggest an indicator of progress
Assignable – specify who will do it
Realistic – state what results can realistically be achieved, given available resources
Time-related – specify when the result(s) can be achieved.”
While there are many examples of objectives that are incompletely defined and don’t meet the SMART criteria, in the case of KPIs things are different. By their own nature and definition, KPIs are indicators of performance with the following inherent characteristics:
Specific – For the objective/ process/ functional area which it addresses;
Measurable – It has to be a metric, therefore it is required to be quantifiable;
Assignable – Ownership needs to be assigned to ensure achievement and improvement;
Realistic – Targets set for the KPIs need to be realistic, taking into consideration available resources, current baselines, benchmarks and market or industry trends;
Time-bound –Targets must have a predefined time, by which they should be achieved.
Consequently, a KPI shouldn’t even be called KPI if the smart criteria are not met. For this reason, the term SMART KPI is in a way doubling down on the SMART criteria.
Our recommendation is that we should not use the traditional approach to defining SMART objectives, but rather ensure that the objective is clearly formulated and easy to communicate. We will then ensure they are ‘SMART’ once we add the KPIs to our objective.
This involves decomposing the traditional approach to ensure clear linkage between performance management tools, concepts and roles such as KPIs, Targets and KPI Owners, thereby ensuring a clear understanding of the SMART criteria and its direct application in organizational contexts.
Project management is no longer just viewed as an end-to-end process, but it is also an area in which skills are in high demand. The Project Management Institute’s “Pulse of the Profession” report shows that senior management increasingly places a high value on project management.
It is also becoming a new culture for nearly half of the organizations. Meanwhile, those who do not consider project management a strategic competency posted 67 percent more of their projects failing.
Today, project managers are compelled to think more strategically as they adapt to the uncertainties brought by the pandemic. That’s on top of dealing with multiple stakeholders and changing market dynamics.
For instance, construction companies and laborers face new disruptions as they execute their projects. A report from Markets and Markets highlights the growing awareness about antibacterial construction materials, volatility in raw material prices, and changes in the supply chain particularly for the residential construction sector.
Given the ever-changing business landscape, how can organizations manage projects successfully and get the most out of their teams to meet deadlines, achieve high productivity levels, and drive results?
They can start with selecting and using the right Key Performance Indicators (KPIs) to achieve clarity, focus, and improvement as they go through the stages and elements involved in managing a project.
Why use KPIs in project management?
A KPI expresses the achievement of the desired level of results in an area relevant to the evaluated entity. In terms of project management, KPIs mirror the quality of the implementation processes, quantitative outputs, and project outcomes.
Based on a survey of over 200 contractors and trade professionals conducted by Dodge Data and Analytics and commissioned by the software company Autodesk, contractors can obtain data by employing digital technology to manage projects, but they do not have a system to process their information and utilize it meaningfully. Having identified the most useful KPIs in the field to interpret overall performance, the study concludes that “by adopting specific processes for project management, contractors can reduce risk, thus minimizing downstream problems and improving performance.”
KPIs are applicable across multiple industries and functional areas. However, they are not the same for every industry or for every company. They are selected based on an organization’s environment, activities, and objectives. You can sign up for the live online course offered by The KPI Institute to learn how to implement a KPI Measurement Framework in your organization.
To give you an overview of the KPIs used in project management, the Top 25 Project Management KPIs – 2020 Extended Edition presents the most viewed KPIs based on the information from smartKPIs.com, a database of over20,000 documented KPIs.
The top 25 KPIs belong to four crucial facets of project management:
Project Budget involves the number of resources allocated to the project.
% Project budget variance
% Project or program budget spent on training
$ Project budget size
Project Assessment refers to the reviewing process of the development of projects and their outcomes.
% Project resource utilization
$ Profit per project
# Cost Performance Index (CPI)
# Project issues addressed ratio
% Requirements changed during project execution
% Project budget overruns rate
# Projects issues identified
# Projects per project manager
$ Project cost savings from innovation
Project Timeline relates to the use of schedules or charts used to plan and subsequently report project progress.
% Overdue project tasks
% Project milestones missed
% Project schedule variance
# Requests for time extension submitted
% Time spent on new projects development
$ Estimate at Completion (EAC)
% Delivery deadlines met
# Time per project task
# Project delay
% Timely production of management reports
% Project completion predictability
Project Team Performance refers to the performance that meets the needs and expectations of company colleagues.
In today`s economic environment, a business`s ability to monitor and measure performance, in all its dimensions, is essential for fostering organizational growth and profitability. This requirement becomes even more challenging within one of the worldwide highest performing industries in the last few years, namely the mobile game industry.
To measure a game’s success before and after its release, gaming studios need to prioritize several areas for optimization and decide what data is the most relevant for decision making. In other words, a game studio should focus on selecting and using Key Performance Indicators (KPIs)that best reflect how they’re performing with meeting their goals.
What success implies can be different from one mobile game to another; however, three essential categories stand out as areas for optimization:
User acquisition – reflecting on how to improve targeting new users
User retention – focusing on how to keep users engaged the most
App monetization – conveying how to increase revenues to sustain further business development
For each of the above categories, there are some essential KPIs a mobile game studio needs to track.
KPIs to monitor mobile game user acquisition
Determining the amount of new daily and weekly users allows the company to discover the number of game installations every week and observe its progress. These KPIs can help the gaming studio team to discover what engagement strategies are or aren’t working promptly.
# Monthly Active Users (MAU) and # Daily Active Users (DAU) are KPIs that allow a business to follow up on its user base over time.
# Monthly Active Users (MAU) – reflects the number of unique users who engaged with the game in the past month
# Daily Active Users (DAU)– measures the number of unique users that participate in at least one session of a game each day
# K-factor – is another fantastic metric that keeps track of the effectiveness of a business’ customer referral strategy. A game’s K-factor represents the number of invites sent by each application customer multiplied by the conversion of each invite. It becomes a quantifiable metric that can afterward be monitored at specific times in the studio’s game development process.
# Invites sent / DAU – isan offshoot of the K-factor metric, which provides a thorough sample of how well a business’ referral program is retaining players that have downloaded and played the mobile game.
% Users acquired virally (virality metric) – reflects how a gaming development business segment its customers, thusmeasuring the percentage of users generated by referrals from its overall existing users.
Monitoring this KPI can also provide insightful data to support an effective marketing strategy, one that works best for increasing a studio’s chances of its game going viral. After observing the virality metrics, a business will be able to segment the information even further, and the segmenting can be done by source, by geographical location, by the time of day or year, etc.
% Conversion rate – measures the proportion of players who decide to invest money into the game, either by acquiring the full game from the demo or lite app version or simply buying an in-game item in the case of the Free to Play title. The conversion rate for each paid object in the game can be calculated so that the business can find out which ones sell the best.
KPIs to monitor mobile game user retention
What KPIs can help mobile game studios develop a long-term strategy that will encourage players to keep playing their game?
% Retention rate – measures the percentage of users who came back to the game after several days in a row
% Churn rate –As opposed to % Retention rate, the % Churn rate of a mobile game app measures the proportion of users who stopped playing during a specific period.
% Average Session Length per User – monitors the proportion of users who play for a long time in comparison to those who leave the game fast. For instance, the distribution of the session length can show what proportion of game sessions lasts less than 10 minutes and how many last for more than 10 minutes.
# Starts, # Fails, and # Successfully level completions – are three metrics that are useful in determining the learning curve of the game. By understanding how difficult the game is in practice, a business could properly adjust their user engagement and boost their retention.
While # Starts emphasizes how many times a player has started a new level, the number of # Fails measures how many times a player has started a level without being able to complete it. Meanwhile, a KPI such as # Successfully level completions measures how many times a user has successfully completed a game`s level.
Gaming studios may come up with different strategies for monetizing their app, and using KPIs can help determine which model can maximize their revenue and suit their audience’s preferences.
$ CPI (cost per install) – measures the amount of money invested in acquiring a new user from paid advertisements.
$ LTV (lifetime value) – measures the total earnings from a relationship with a user who installed and paid for the game over that customer’s life span.
$ Return on Investment – measures how much profit was generated out of the total cost of an investment, reflecting on the difference between $ LTV (lifetime value) and $ CPI (cost per install). If the value of this metric falls in the negatives, it denotes that the studio is keeping the game alive at a loss.
$ Average Revenue per User (ARPU) – measures the amount of income generated by each active user.
To better understand how the game’s revenue-generating potential is best achieved, two similar KPIs should be monitored, namely: $ Average Revenue per Paying User (ARPPU) and $ ARPDAU (Average Revenue per Daily Active User).
A game studio’s ability to visualize the relationship between acquisition, retention, and monetization KPIs can provide extraordinary insights into a game’s growth and profitability. By combining the acquisition and retention measurement results, powerful trends can be observed and lead to customer satisfaction and customer stability.
By combining retention and monetization, a business will quickly discover what kind of user behavior translates into its most profitable users.
 3. Internal procedures: Internal procedures are a necessary tool in breaking down processes into KPIs and process optimization thereon forward. They also deliver a standardized template for capturing specific process information.