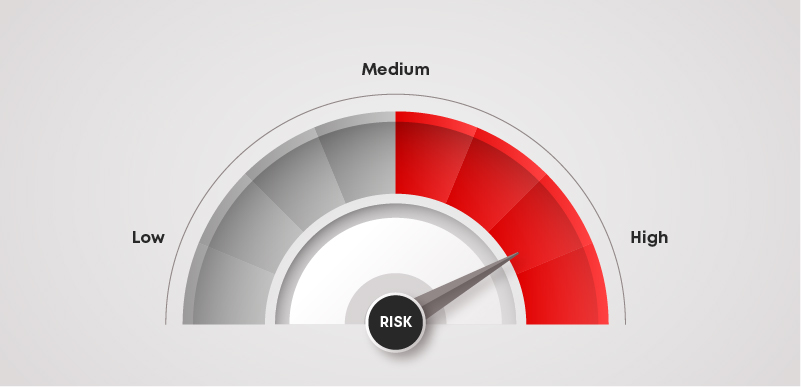
The KPI Theatre: When Organizations Start Performing Metrics Instead of Performance



There’s a weird phenomenon that happens in a lot of organizations: the dashboard glows green, leadership’s presentations are slick, KPIs are marked & reached, and status meetings are optimistic. Everyone sounds confident.
Yet, somehow, despite the appearance of success, people inside the organization quietly know that things are not quite right: teams are exhausted, delivery deadlines are missed, customers are frustrated, and employees are constantly fighting fires. No one can really trust the reports anymore, but the numbers are still saying everything is fine.
This is the start of what is known as KPI theatre.
It doesn’t have to involve fake data or blatant dishonesty most of the time. KPI theatre is more subtle than that. It begins when organizations slowly shift away from using metrics to understand reality to using them to create the illusion of control and stability. The KPI becomes moreso a performance trick rather than a sensor of reality.
When that happens, the organization starts optimizing for what things look like, rather than for how they actually work; this phenomenon has become more common than many would like to admit, with the use of dashboards for every conceivable objective under the sun.
They can track customer clicks across dozens of touchpoints, monitor employee activities in real time, report on operational output minute by minute, and have automatically generated executive reports delivered before breakfast.
Even with all this visibility, many organizations are further removed from operational truth than ever because measurement doesn’t automatically create clarity. In fact, under the wrong conditions, measurement creates distortion. This mindset is even more pronounced when careers, budgets, promotions, bonuses, vendor relationships, or executive credibility are tied to keeping the dashboard green.
When Metrics Stop Measuring Reality
There’s an old economic/organizational theory called Goodhart’s Law. The essence is this:
“When a measure becomes a target, it ceases to be a good measure.”
It sounds a bit abstract at first, but once you start to notice it, you see it everywhere:
- A customer support team is asked to lower its average handling time. It does so by ending calls before the problem is resolved.
- A marketing team is rewarded for lead volume. It sees a lead quality decline.
- A social platform optimizes for click-through rate and accidentally discovers that outrage is more performant than usefulness.
- A company is congratulated on its record-setting productivity levels, while employees quietly burn out behind closed doors.
The metric improves, but the system declines, and it is here that KPI theatre often starts: when the organization prioritizes the proxy over the actual thing it was supposed to represent.
The problem isn’t with metrics themselves. Organizations do actually need KPIs, visibility, and performance indicators. The rub is that as soon as metrics are directly tied to human action, human behaviour changes; the more pressure there is on the metric, the greater the distortion becomes.
This is because people act on a natural, normal human instinct. It is less malice that drives the shift and more so humanity itself. Once survival, status, or rewards are tied to the number, the organization unconsciously redesigns itself around protecting that number.
This is why many KPI systems drift away from reality over time. Not as one big deception, but through thousands of small behavioural adjustments:
- A delayed escalation here
- A redefinition of a milestone there
- A subtly optimistic framing of a report
- An inconvenient operational reality hidden from the dashboard because “it would just confuse leadership“
By the time an organization gets around to reviewing it, it has become extremely adept at producing the appearance of performance and extremely incompetent at telling the truth.
The Dangerous Simplicity of “Green“
Perhaps one of the clearest indicators of KPI theatre is what some transformation leaders call the “Watermelon Effect“: from the outside, everything appears green; on the inside, everything is red.
If you’ve worked with major transformation programs, large corporate initiatives, or substantial operational projects, you’ve likely encountered this phenomenon. Status dashboards remain green for months on end while teams at the ground level are drowning in missed dependencies, unrealistic timelines, resource shortages, leadership infighting, or delivery chaos.
However, nobody wants to be the bearer of red, for in many organizations, green is rewarded and red is seen as failure. As soon as that cultural message is understood, reporting becomes less about operational truth and more about political survival.
This is why some organizations have entire portfolios in which every project and program is “green,” despite clear evidence of failure all around.
The dashboard becomes a ceremonial accoutrement, and the reporting process becomes ritualized, while everybody participates in maintaining the illusion because no one wants to be the “negative Nancy.“
Over time, teams learn a dangerous lesson: it is safer to appear to be in control than to admit problems early. Once that lesson is learned, KPI theatre proliferates rapidly:
- Problems begin to emerge later, and escalations are delayed, lost in perpetual limbo.
- Concerns are softened before reaching leadership, and people are rewarded for managing appearances rather than for improving outcomes.
What makes it so dangerous is that many organizations mistake such false peace for operational maturity, but forget that healthy organizations are not permanently green. Healthy organizations identify and surface problems quickly and escalate risks early. In a healthy organization, there is psychological safety to say “this isn’t working.”
In fact, some of the most operationally mature organizations are those where red occurs often, because people trust the system to handle reality accurately. The organizations at the greatest risk are often those that appear the safest.
When Teams Learn to “Look Green”
The longer the KPI theatre persists, the more human behaviour starts to adapt at the deepest level. The team asks less about “How do we solve the problem?” and more about “How do we make this look acceptable?”
This fundamental change shifts everything: delayed milestones are “re-scoped,” and a failing project is “still in progress.”
The language becomes smoother, and the operational reality much harder to access. Dashboards transform from management tools into reputation-management systems. From that point on, leadership begins to function based on a carefully filtered, highly distorted version of reality.
Perhaps the most well-known example of this dynamic was the Wells Fargo account scandal.
Aggressive cross-selling targets were tied so closely to performance evaluations and survival that employees began opening unauthorized accounts solely to meet the KPI.
From their leadership’s perspective, the metrics were brilliant. The dashboard was green, the numbers were green, everything was green. Cross-selling soared sky-high, and targets were met with almost surgical precision. Yet, beneath the surface, the system had been utterly corrupted. The endgame for KPI theatre lay unveiled: employees optimize for the appearance of success because real success has become impossible to achieve or politically hazardous.
What’s most critical to remember here is that organizations do not have to be fraudulently engaged to experience this kind of distortion. Even perfectly well-intentioned and legal KPI systems can, slowly and steadily, slip into theatre when metrics begin to overshadow judgment.
Such distortions explain why so many organizations become obsessed with metrics that feel productive but have very little operational impact: activities occur, but they have no strategic outcomes.
Thus, visibility is mistaken for understanding because dashboards offer us a comforting illusion: if we measure everything, surely we are in control. In reality, it is often the opposite. The more tightly we hold on to keeping dashboards green, the harder it is to see the truth, and reality always sends a bill in the end.
Why Dashboards Give Us a Sense of Control
There is something incredibly reassuring about dashboards. Executives review them every morning; managers pore over them before meetings; teams track them throughout the day; organizations now operate entirely through screens filled with charts, percentage points, arrows, heat maps, and colored dots.
The modern dashboard appears to be a control panel that may solve many issues, save that of organizations mistaking visibility for control. Under the obstinate, ever-constant watch, the feeling that something significant is happening is generated simply by watching numbers shift-even if nothing real is being done. This leads to what some analysts refer to as the “illusion of control,” in which constant monitoring is mistakenly believed to influence results merely by its presence.
However, monitoring the metric is not the same as improving the system behind it.
- An organization can monitor customer satisfaction metrics by the hour and still consistently mistreat customers
- Leadership can obsess over productivity figures while employees quietly disengage
- A business can implement spectacular real-time dashboards while strategic execution slowly falters beneath the surface
Psychologically, dashboards feel productive. Checking them feels like engagement and activity, while refreshing them feels like stewardship and management.
Over time, an unhealthy addiction to their comfort develops. A manager looks at the dashboard, sees good numbers, and is awash with reassurance; an hour later, the uncertainty returns; another glance at the dashboard – the same cycle unfolds.
What began as an operational check has become a tool of emotional regulation. One reason so many organizations now spend so much time observing performance rather than working to improve it is that they have discovered how readily dashboards fulfill their emotional needs.
Dashboard Hypnosis and the Addiction to Monitoring
KPI culture has subtly created something akin to organizational compulsion. Many leaders now view dashboards obsessively, even if the underlying metrics have not budged in any meaningful way.
We check at the start of the day. We check before each meeting. We check during the meeting. We check after the meeting. We check at the end of the day.
The problem here goes beyond wasting time, bleeding into an obsessive-compulsive conduct that shapes decision-making through constant monitoring.
- Slight increases look like major strategic successes.
- Random noise is interpreted as meaningful trends.
- Organizations become reactive to the data rather than analytically grounded.
This can be especially problematic when there is a significant level of uncertainty surrounding the market. Faced with stress, human beings look for patterns and quick explanations, all of which the dashboard is designed to provide. A small, weekly jump in web traffic is taken as evidence that a marketing campaign has been brilliantly successful. A slight monthly decline causes panic, even if overall trends are positive. A minor hiccup in a manufacturing process is elevated to a strategic crisis merely because it appears visually alarming on the dashboard.
The dashboard begins to shape emotional responses within the organization, and because we are all visual creatures, it also shapes interpretations, even if the data it presents is perfectly accurate. Red means dangerous. Green means good. Down means bad. Up means good.
Organizations develop a kind of “dashboard hypnosis,” in which they spend endless hours analyzing highly visible metrics and fail to notice the actual operations they reflect. They spend so much time on indicators that they forget what produced them.
The Psychology of KPI Theatre
Once the mania of dashboards sets in and KPI theatre plays out within an organization, an interesting phenomenon begins to occur.
The distortion ceases to be merely structural and instead becomes psychological. At this point, the problem is no longer solely about incorrect measures or flawed dashboards. The organization itself begins to psychologically and emotionally adapt to the measurement systems surrounding it.
- People cease to engage with KPIs rationally
- They begin to engage emotionally with KPIs
- The dashboard becomes a source of reassurance, anxiety, political signaling, self-preservation, and even identity
Before long, KPI theatre becomes a play of shapes & shadows – difficult to spot and make sense of because, at this point, the organization often believes its own reporting.
The Cognitive Traps That Twist KPI Decision Making
The reason KPI theatre is so compelling lies in our natural vulnerability to cognitive biases. We do not interact with our dashboards purely rationally; we interact with them emotionally, with expectations, under stress, and using mental shortcuts.
1) Confirmation Bias
Humans have a tendency to note what we expect and discount the unexpected.
If leadership is deeply committed to a particular transformation project, then a green indicator becomes an incontrovertible proof of its success, while a red indicator is simply explained away.
If leadership has already invested heavily in a strategy, the dashboard becomes a tool to validate their current opinion rather than challenging it.
2) Anchoring
We tend to let the first data point that we see on a dashboard shape all subsequent interpretations of other metrics.
A dashboard that begins with “Revenue Up 20%” immediately gives us a positive context for interpreting other numbers, even if our profitability, customer retention, and operational efficiency are silently collapsing.
3) Recency Bias
Inflated significance is bestowed upon numbers we recently saw.
A temporary spike gives us a sense of urgency and accomplishment. A short-term decline triggers fear. This is particularly problematic when our data streams provide real-time feedback; the more quickly and continuously we can monitor our data, the more tempted we become to react immediately to short-term noise.
To a certain extent, KPI theatre is not a measurement problem at all, but a problem of attention. Organizations train themselves to look for the most obvious and easily replicable answer, even if it is strategically unimportant. This is the root cause of the attractiveness of vanity metrics.
Vanity Metrics and the Satisfaction of Being Busy
Most organizations track far too many metrics. It’s not necessarily because all metrics are useful (they’re not, objectively); it’s more about the reassurance they provide.
A crowded dashboard feels complex. A scoreboard may simulate the culture of active competition. A long, printed performance report feels operationally mature. An organization that can report on hundreds of metrics appears highly data-driven. However, many of these numbers offer little that influences high-level decision-making.
For instance, we track web traffic that never converts. We measure social media engagement without understanding its relationship to revenue or customer loyalty. We track customer satisfaction, but our data tells us nothing about retention. We conflate activities with outcomes.
The simplest test to detect KPI theatre within an organization is to ask this question, very directly: “If this metric were to vanish tomorrow, would the business be harmed in any tangible way?” In most cases, the answer is no. The metric is likely a product of looking good, feeling busy, creating a false sense of rigor or control, and satisfying the need for oversight.
At this stage, organizations often conflate outputs with outcomes; the production of many reports is mistaken for clarity; the increase of activity is taken as a synonym for progress; task completion is conflated with value creation. Additionally, since vanity metrics are naturally more easily improved than actual operational indicators, the organization naturally drifts towards optimizing these easier targets. Hence, some departments become exceptionally proficient at generating positive reporting while delivering minimal value to the organization’s overarching goals.
Marketing measures engagement; sales measures lead generation; operations measures throughput; finance measures cost control. Yet, few, if any, take a step back to ask whether the overall health and performance of the business are improving. The KPI system begins to fragment reality into separate, performative zones of success.
Executives Rewarding Confidence Instead of Truth
At the heart of the KPI theatre problem is almost always a cultural problem, not a technical one.
People learn very quickly what sort of reporting gets rewarded. In some organizations, honesty is rewarded. In others, confidence is rewarded. These things are not equivalent. When leaders reward certainty and “green” reporting, while punitively penalizing ambiguity or “red” reporting, individuals will self-correct to adapt to these rewards.
Issues are understated → risks are deferred → warnings are carefully phrased.
The organization thus learns to sandbag bad news until it reaches leadership, and, in the process, reality becomes self-filtered before it reaches the executives.
This is one of the key reasons that pathological KPI cultures become self-perpetuating and almost impossible to fix. Reporting systems become so political that operational reporting shifts from communicating information to managing perception. Once metrics are no longer about truth but about executive comfort, personal safety, optics, or career protection, real numbers start to disappear.
Ironically, the most fragile, volatile companies will tend to have the smoothest reporting cultures. This is because when there’s no incentive or security in raising issues early, they tend to multiply unseen under the surface until they can no longer be ignored. Dashboards stay green until reality hits everything simultaneously, and leadership is often blindsided because, in addition to the red flags, the KPI theater culture taught them to hide.
How KPI Theater Drives Organizations
KPI theatre doesn’t usually come crashing down immediately, which is why it’s so dangerous. In the short term, cultures of performance measurement can appear extremely successful: dashboards are up to date, targets are regularly met, reporting is clear, quarterly presentations are slick, and executive meetings feel decisive.
On the outside, organizations look structured and data-driven. On the inside, something else is going on behind the scenes – reality is slowly being removed from the system. Ultimately, organizations reach the point where leadership isn’t managing operations but managing an elaborate simulation of operations. This is when KPI theatre is expensive, almost prohibitively so.
The Wells Fargo Scandal: When Performance Goals Become Survival Mechanisms
We briefly touched on earlier that one of the starkest modern examples of KPI theatre turning into a disaster was the Wells Fargo fake-account scandal.
The company has placed significant emphasis on aggressive cross-selling goals for years. Employees were under immense pressure to meet sales KPIs that were directly tied to performance appraisals, compensation, and internal incentives. The metric itself appeared reasonable in concept: more products per customer signified improved relationships.
Over time, however, the goal evolved from a measurement tool into a means of survival. Employees therefore adapted to the system by opening unauthorized accounts, forging signatures, duplicating existing accounts, and signing up customers for services they didn’t want or understand. The dashboards seemed excellent, and the numbers suggested that the company was growing, making leadership confident that their strategy was working.
This highlights one of the key truths about KPI theatre: when incentives become strong enough, people will start serving the metrics rather than the goal. Crucially, this doesn’t usually start maliciously; it’s usually the rational result of people reacting to their environment. If unrealistic targets are tied directly to your job security, you will change your behaviour accordingly. The system will quietly start teaching people what matters most; for most, it’s simply keeping the numbers in the green.
How KPI Cultures Lead to Organizational Blindness
One of the most insidious consequences of KPI theatre is blindness.
Organizations lose the ability to see their own decline because their reporting systems filter the data before it reaches leadership. This is a gradual process:
- Employees stop escalating issues they should escalate because they believe these must be “fixed quietly.”
- Managers tone down bad news before it reaches executives, and operational problems are spun in a positive light.
- Metrics that cause distress quickly get removed from dashboards altogether.
- The organization learns to protect leadership from operational truths.
This creates an institutional hallucination in which the organization begins to believe its own narrative, even as it becomes increasingly evident that the underlying system is failing. Such a scenario becomes particularly dangerous in large organizations, where leadership depends entirely on summary reports. At that point, the dashboard is not a summary – it is the reality.
Leadership makes decisions based on these dashboard reports, determining where resources are invested, what projects are prioritized, and how people are rewarded. Since dashboards must simplify complexity, anything that doesn’t fit neatly into a measurable category is lost.
Culture becomes invisible. Employee exhaustion, customer frustration, and strategic confusion are all hidden. The organization fails to see its own capability eroding. Instead of managing what matters, the organization is managing what is easily quantifiable. This is the reason why companies can be operationally weak long before their financial performance deteriorates, as KPI systems mask all of the early warning signs.
Why Most Businesses Measure Activity Rather Than Results
One reason KPI theatre proliferates easily is that outputs are easily quantifiable and displayable, as well as easy to analyze in meetings.
“How many?” “How quickly?” “How much?”
These are easy metrics to monitor on a dashboard and produce neat results. They say little about true value. They are more likely to generate reports such as: more content produced, more customer calls made, more campaigns created, more calls to a helpdesk taken, more meetings conducted, and more hours billed. However, it’s impossible to be sure whether any of this equates to success.
A call center may have low resolution times, yet leave customers dissatisfied; a marketing campaign might receive high traffic figures but fail to generate significant revenue; a transformation office may reach certain milestones while the overall transformation fails. This is why KPI theatre thrives in hyper-busy companies: many believe they are performing well because they are doing so many activities, but in fact, they lack real effectiveness.
As outputs create strong signals of progress, businesses are increasingly obsessed with quantifying them. Outcomes require more detailed data and longer timelines to understand, but also offer much more accurate feedback on what works and why. Outputs simply make the organization appear efficient, whereas outcomes determine whether that efficiency translates into tangible success.
Useful KPIs Versus Corporate Performance Art
Not all KPIs are useless or inherently harmful; not all dashboards are deceptive. The key problem is not measurement itself, in a vacuum, but rather measurement becoming detached from learning.
This is the core distinction: healthy organizations use KPIs as indicators; poor organizations use them as shields.
Healthy KPI systems provide an opportunity to understand what’s happening; poor KPI systems are an excuse for management to look good. Healthy organizations use metrics to start conversations; poor organizations use them to protect their positions. Healthy KPI systems expose problems early; poor KPI systems conceal them until they’re unavoidable.
The simplest way to tell the difference is by the organization’s reaction to poor metrics: in a healthy system, red metrics trigger investigation; in a poor system, they trigger fear. Fear immediately causes a change in behaviour; people stop experimenting, escalate their concerns, challenge assumptions, and start manipulating their work to look good. This is why many of the world’s most advanced dashboard systems yield extremely poor strategic results. The organization believes it’s intelligent simply because it can visualize data; dashboards, without context, judgment, analysis, and psychological safety, are nothing more than a way of performing competence.
Metrics That Reflect Truth, Not Protect the Narrative
We can’t get rid of metrics. Organizations need performance indicators. They need accountability. They need visibility into operations. They also need to build systems focused on truth over appearance. Building metrics that reflect truth requires a fundamentally different philosophy toward measurement.
1) We cannot treat single metrics as sacrosanct indicators of success.
Single-number governance inevitably leads to distortion as employees naturally work to meet whatever target has become the central focus of attention.
2) We must build in counter-metrics.
If the call center metric focuses on response time, metrics around the quality and resolution rate of each call must be included. If response time improves at the expense of the customer’s quality experience, the KPI system must immediately flag this trade-off.
3) We need to separate learning metrics from punishment metrics.
Employees cannot engage in truthful experimentation if all metrics are linked directly to individual evaluations or to political threats. The moment employees are afraid of a metric, it loses its ability to measure honest behaviour.
4) Leaders must reward transparency, not just performance.
Employees must feel empowered to voice: “This isn’t working.” “This metric is no longer measuring what it should be.” “We’re hitting the number, but the system underneath is collapsing.” These are uncomfortable statements, but if organizations aren’t able to identify them early, the realities of operational collapse are inevitable.
5) Companies must continuously question whether their KPIs continue to measure what they were originally intended to measure.
Metrics decay. Markets change. Customers change. Organizations change. The metric that accurately reflects business health in one era becomes utterly irrelevant or actively misleading in the next, yet the reporting system remains the same, allowing companies to manage history rather than current reality.
Final Thoughts
The real problem with KPI theater is not the measurement of performance, but the over-reliance on that measurement at the expense of genuine judgment.
If the dashboard says we’re performing well, we assume performance is indeed good. Meanwhile, the employees and operations below the surface often know better, seeing that targets are artificial, reporting numbers are massaged, milestones are quietly redefined, and results don’t reflect actual business value. Once the culture accepts KPI theater, the risk of honest dissent outweighs the reward of participating in the performance.
It is then that the organization becomes fragile. It is at this point that we find reality not just ignored, but also denied. Customer satisfaction plummets. Employee burnout rises. Projects stall. Markets shift. Operational weaknesses compound, finally bringing leadership to a rude awakening: we weren’t managing performance; we were managing appearances.
The real danger of KPI theater lies not in bad numbers, but in good numbers that have stopped measuring anything real.
**********
Whether you’re new to performance measurement or looking to refine your expertise, continuous learning makes a difference. Take the next step with The KPI Institute’s Online Certified KPI Professional.