Energy use in organizations
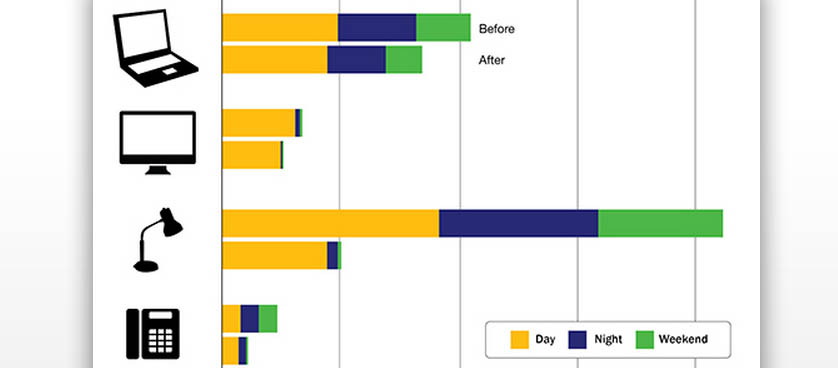
More and more, organizations are increasing the focus on the environment, in the idea of reducing their footprint and protecting the climate. A team from Carnegie Mellon University’s School of Architecture has designed a dashboard to monitor how much energy employees use at work.