Financial Performance Benchmarking within Water Utilities Companies

Back in 2017, we launched an extensive secondary benchmarking initiative, through our Center for Performance Benchmarking and Utilities Performance Labs, consisting of 6 individual reports; 2 reports for each of the 3 utility sectors – water, gas, and electricity. The fourth report of the Utilities Performance Benchmarking Report Series 2017, “Financial Key Performance Indicators for Water Utilities” launches the part of financial reports from the series and includes data from 36 water utilities located in 13 countries situated on 5 continents.
The companies were chosen in order to showcase the level of financial performance from different world regions as geographical matters can influence to a certain extend the operations and the geographical coverage of utilities companies. Moreover, in order to enable comparison for a wide range of companies, the report includes companies with different structures in terms of size, number of employees or departments.
Financial gains surely are on top of priorities for all for-profit companies, independent of the sector they activate in. While for the non-financial indicators companies have more flexibility in regards to what they measure, in terms of financial KPIs, the performance management framework in place is more stable, hence most companies measure more or less the same KPIs, facilitating comparison among companies through a benchmarking initiative.
The aim of the Utilities Performance Benchmarking Report Series 2017 is to enable professionals to activate new KPIs within their utilities organizations based on their usefulness for other companies from the sector, to help them set targets for the newly activated KPIs or to facilitate the comparison of the results for organizations that already measure those indicators.
The 19 key performance indicators included in the report were structured into a comprehensive framework consisting of 5 clusters further divided in sub-clusters if the case. The KPIs contained by the report were selected by the specialists from The KPI Institute based on their experience and based on an initial market analysis.
A) The first cluster, Assets and Liabilities is divided in two main sub-cluster: Assets, showcasing expected financial benefits within one year, and Liabilities, reflecting on the expected debt within one year.
Out of the seven indicators included by this cluster, we found that $ Total assets and $ Total liabilities are the two KPIs reported by most of the organizations included in the report, as shown in the histograms below:
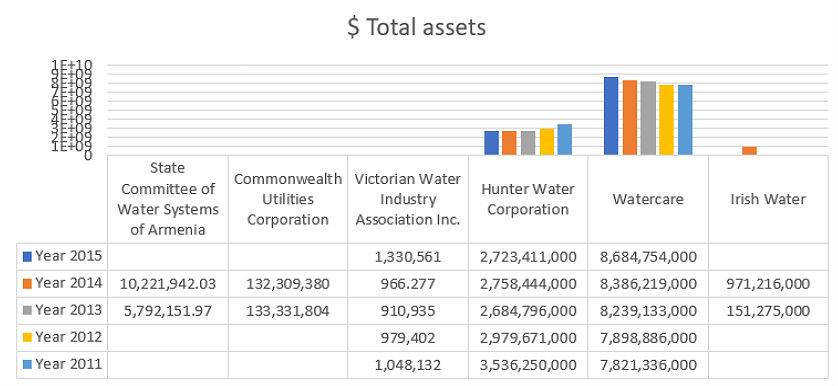
- $ Total assets measures the value of the resources controlled by an organization as a result of past events and is expected to generate economic benefits in the future.
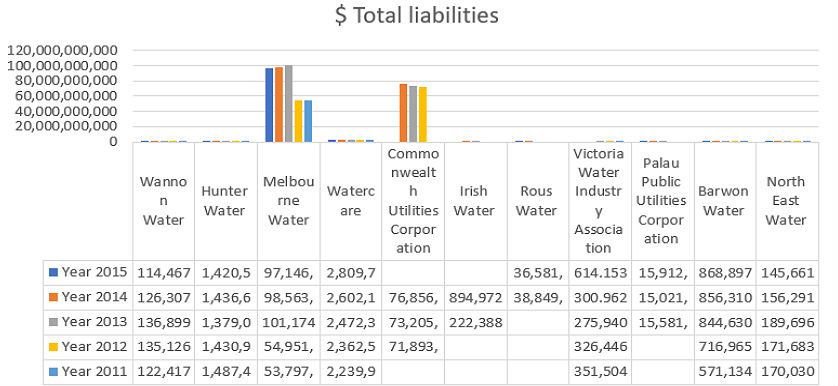
- $ Total liabilities measures the value of obligations an organization has towards others from past events or transactions, expected to result in an outflow of resources.
B) The Revenues and Costs cluster includes 3 KPIs, which reflect on the cash flow of the water utilities organization. For example, in what concerns water organizations, we have noticed that $ Operating expenditure is the KPIs used more frequently for measuring the costs the company has.
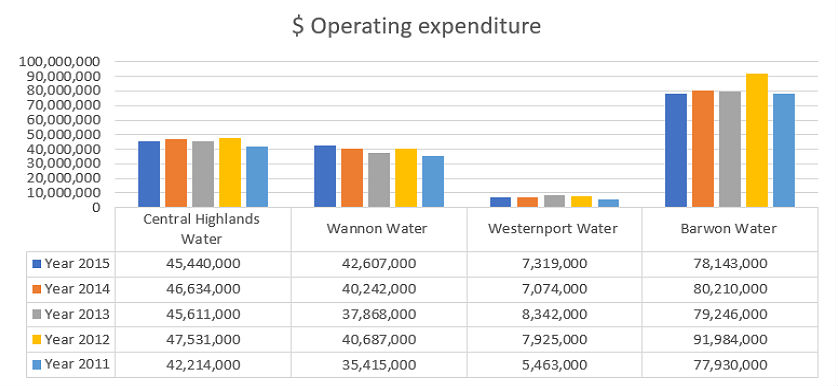
- $ Operating expenditure measures the company’s expenses during regular business activities in a given time period. Generally, represents a separate item to the cost of goods sold (cost of sales).
C) The third cluster, Profitability, pinpoints, through 4 main KPIs, on the financial performance and earnings of water utilities. The most representative example of KPI in practice seems to be % Return on assets.
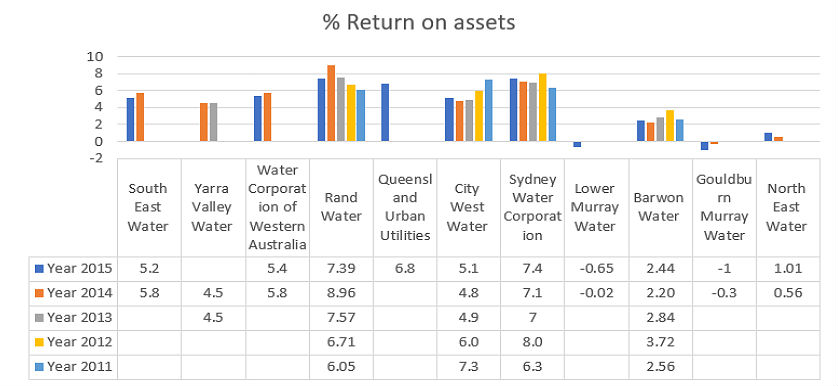
- % Return on assets measures the percentage of earnings generated, from invested capital or assets.
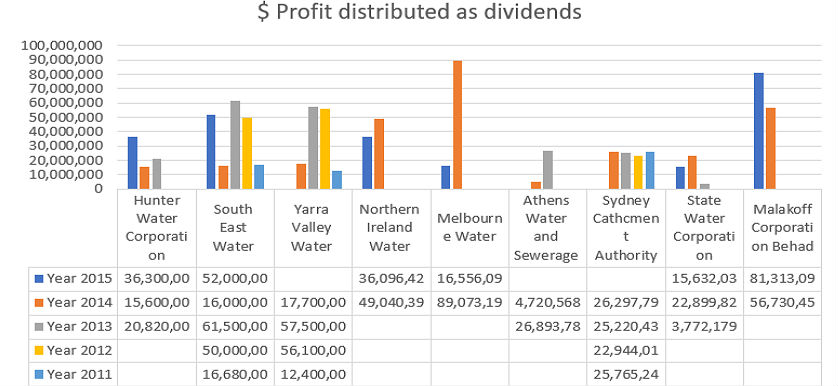
D) The Shareholders’ Profitability cluster contains 3 metrics related to the gains of the organization’s shareholders. For example, $ Profit distributed as dividends which measures the volume of profit distributed as a payment to the organization’s shareholders.
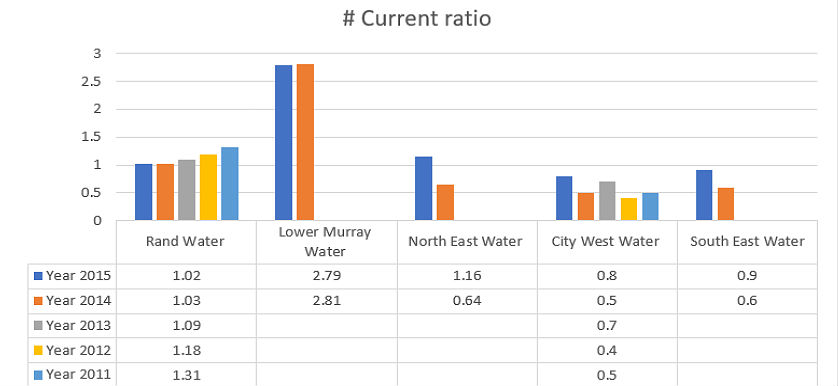
E) The Financial Stability is a 2 KPIs group that reflects on the organization’s ability to pay its short and long-term obligations. # Current ratio is most frequently used in practice in order to showcase the financial stability of an organization as it measures the relationship between short-term obligations (debt and payable) and short-term assets (cash, inventory, receivables), giving an indication of liquidity, or the company’s ability to pay its short-term obligations.
In order to accurately analyze the data, we will take as an example the $ Operating expenditure. In the graph above we have data from 4 companies located in Australia:
- Central Highlands Water- about 200 employees;
- Wannon Water – 188 employees;
- Westernport Water – 57 employees;
- Barwon Water – 319 employees.
Based on the number of employees and additional information, such as the number of customers or connections and the geographical coverage their service has, we can choose the most suitable benchmarking partner. If, for instance our company has around 200 employees, at a first glance, the most representative benchmark for us would be the results of Central Highlands Water and Wannon Water.
Image source:

Tags: Key Performance Indicators, KPI, Report Analysis, Utilities performance