Data visualization post-Tufte: levers of chart-making and cognitive load

Image source: Artem Podrez | Pexels
Edward Tufte’s principles of data-Ink ratio have prevailed in data visualization since they were introduced in the 1980s. His theory has imposed a tendency towards a minimalistic style, defining excellence as clarity, precision, and efficiency and reducing the time users perceive information.
Meanwhile, academic research that has put the American pioneering statistician’s teachings to test does not show the linear relationship between data-ink ratio and visualization’s excellency. Further research shed light on other important criteria that Tufte overlooked, like the ability of a visualization to induce attention, memorability, and engagement. Overall, the academic body of literature has strongly suggested that no simple rule like data-ink ratio can suffice in data designing.
Debates among practitioners have been ongoing about the repeated notion of “less is more,” which leans back on Tufte’s teachings. Some believe that simplicity and quick perceiving should be the goals of all visualizations at all times. Others support embracing complexity and slow viewing time in some circumstances.
As a response to these debates, two interesting frameworks have emerged to suggest more criteria that should be considered. The first is “Levers of Chart-Making” by Andy Cotgreave, a senior data evangelist at Tableau, and the second is “Cognitive Load as a Guide” by Eva Sibinga and Erin Waldron, data science and visualization specialists.
Levers of chart-making
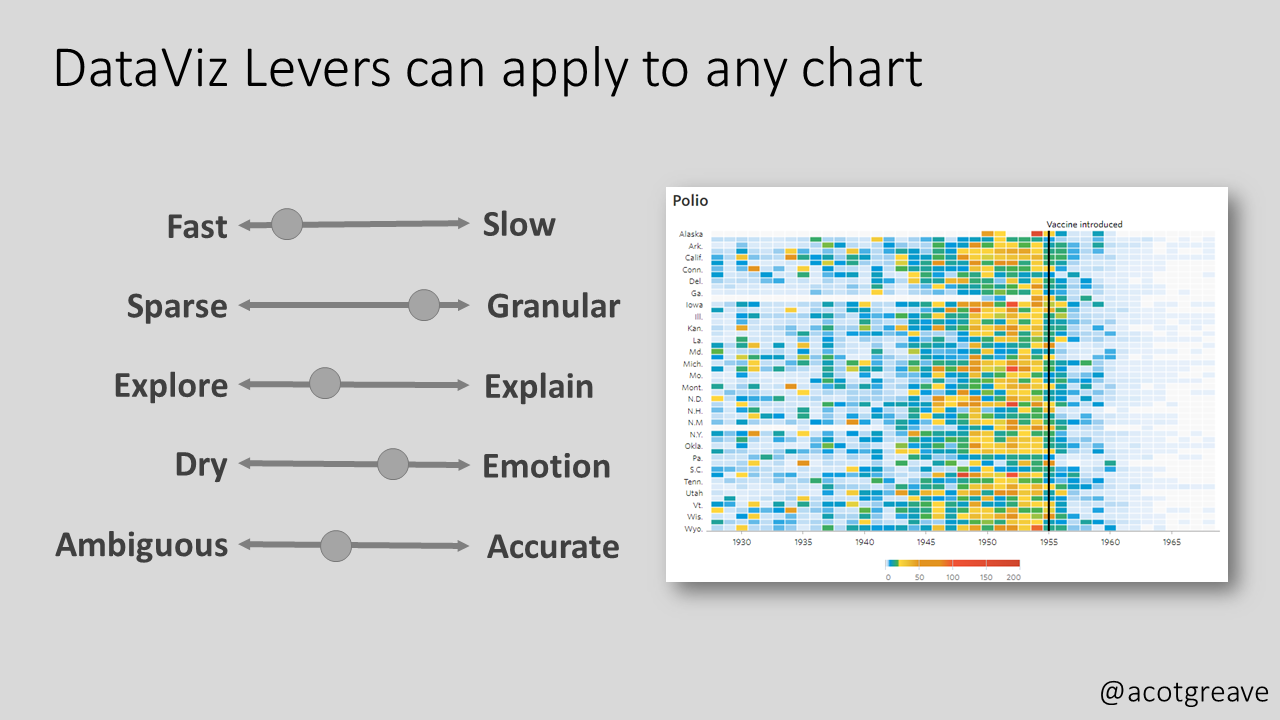
Image Source: The Sweet Spot
Cotgreave suggested this under-formulation framework in the November 2022 edition of his newsletter The Sweet Spot. He put forward five scales of levers that “chart producers can use to enlighten, not bamboozle.” They are as follows:
- Speed to primary insight – How fast or slow insight is intended to be extracted from a graph According to him, “it is ok to make charts that take time to understand”.
- Granularity – How sparse or granular is the data that a chart intends to show?
- Explore or explain – whether a visualization is intended to give the users the opportunity to explore the data themselves (like self-service dashboards) or to be accompanied by an explaining presentation
- Dry or emotional – refers to how serious the way of presenting the data is versus how informal and relevant it is to non-data people. According to Cotgreave, an example of the serious approach is a normal column chart and for the emotional, a necklace of which the bead’s size represents the same underlying data.
- Ambiguity vs. accuracy – For Cotgreave, there can be intended ambiguity in chart-making instead of clear accuracy.
Cognitive load as a guide
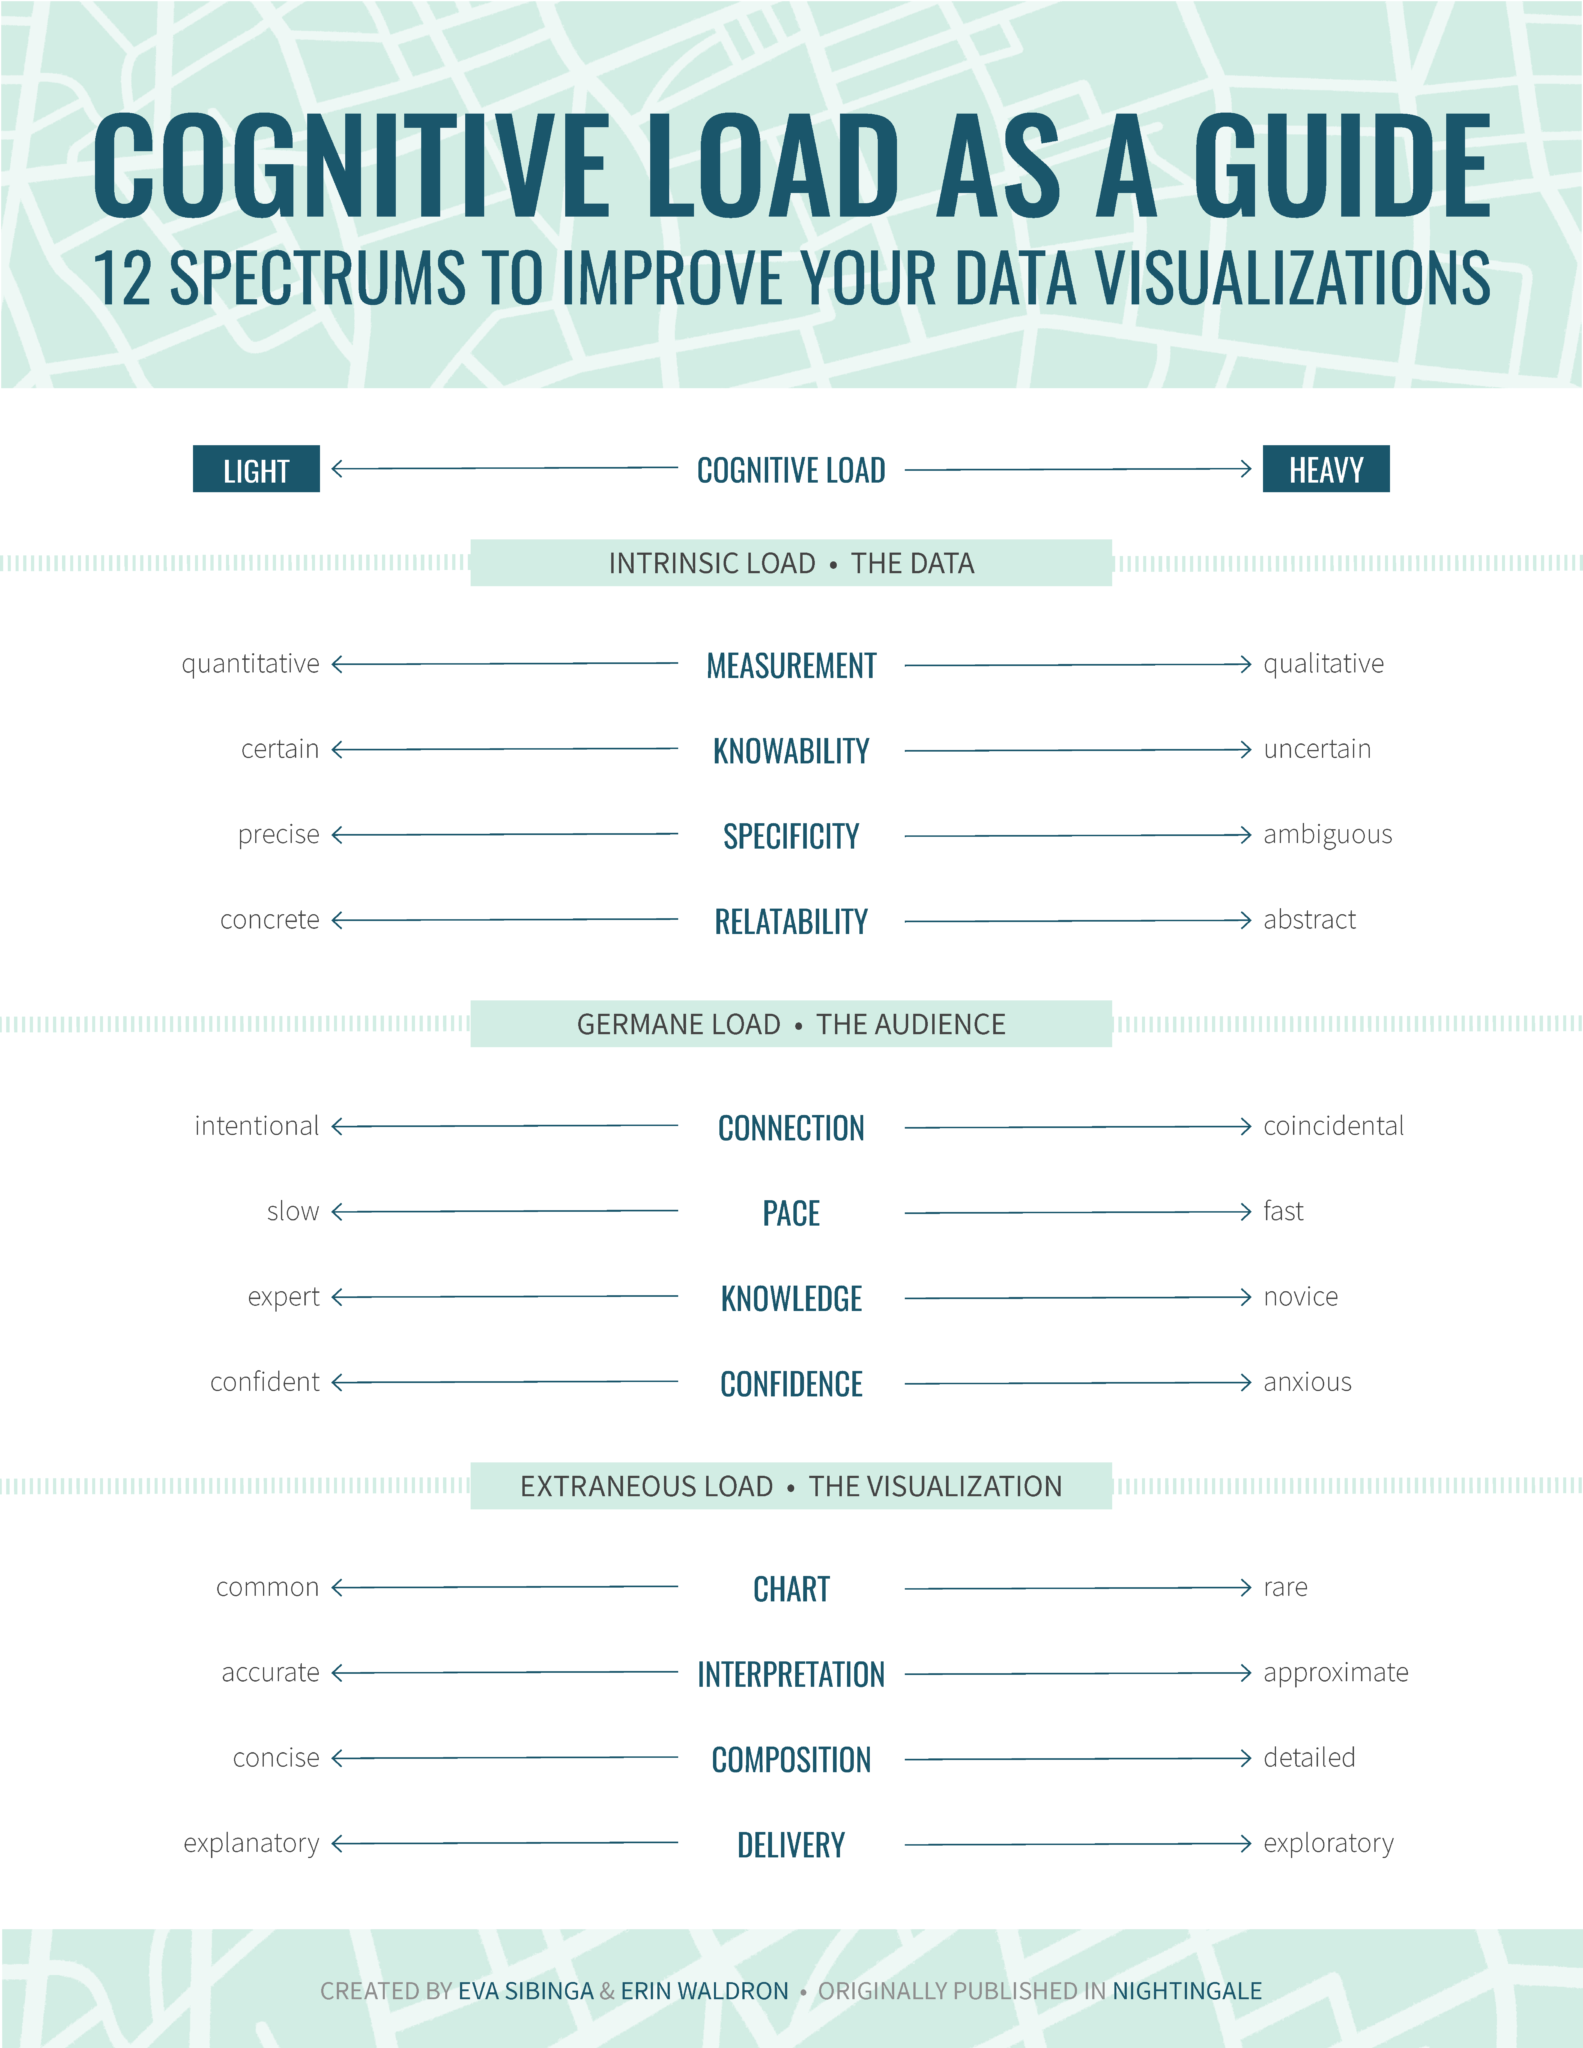
Image Source: Nightingale
Cognitive load is a more detailed and rigid framework that takes its inspiration from the psychology of instructional design. Suggested by Sibinga and Waldron, the framework was published by the Journal of the Data Visualization Society (Nightingale) in September 2021.
Cognitive load proposes 12 spectra, offering “an alternative to one-size-fits-all rules” and aiming to “encourage a more nuanced strategy” for data visualization. Divided into three categories, the spectra are supposed to “gauge the complexity of our data on one side, identify the needs of our audience on the other, and then calibrate our visualization to successfully bridge the gap between the two.”
Intrinsic load – This is the first group of spectra that is concerned with the data itself. It considers the inherent level of complexity in the data that a designer is tasked to explain with a visualization. The included spectra are:
- Measurement (quantitative vs. qualitative) – According to the authors, quantitative data has less cognitive load (easier to perceive) than qualitative data. That is because the former usually has obvious measuring units, like dollars or miles, while the latter usually needs a conceptual rating scale, like satisfaction rate from 1 to 5.
- Knowability (certain vs. uncertain) – Data collected from the whole population is easier to perceive than data estimated depending on a sample or predicted for the future. This is because the former usually has a high level of certainty that is easier to perceive than the uncertainty that comes with the latter, intertwined with its inevitable statistical margins of error.
- Specificity (precise vs. ambiguous) – Undebated data categories, like blood type or zip codes, tend to be easier to perceive than socially determined concepts, like gender, race, and social class.
- Relatability (concrete vs. abstract) – How relatable is the data to what humans see in everyday life? Concrete data would be small numbers like the cost of lunch and one’s age, while abstract data would be conceptual ones like GDP and the age of the earth.
Germane load – The second group of spectra is concerned with the audience and how ready they are to process the new information shown by a visualization. The included spectra are:
- Connection (intentional vs. coincidental) – How will the audience have the first look at the visualization? Intentional viewers are likely better propped to perceive the visualization than viewers who stumble upon it by accident.
- Pace (slow vs. fast) – Slow viewers are the ones that have more time in hand and therefore +have more ability to perceive a visualization (interpreting into lighter cognitive load).
- Knowledge (expert vs. novice) – Expert viewers are the ones who are already familiar with the subject and therefore will have to afford lighter cognitive load when viewing a visualization.
- Confidence (confident vs. anxious) – This spectrum addresses the intersection of the audience and the data reporting format. The cognitive load that is required from an audience familiar with the data reporting format, such as an interactive dashboard and a data-based report, will require lighter cognitive load than the one that is encountering such a channel for the first time.
Extraneous load – The final group addresses how new information is presented. The authors believe that these are the criteria where a designer has the most control and should therefore be considered last. The advice to determine a visualization’s place on the following spectra is by answering the question: “Given the existing intrinsic and germane loads, how much more cognitive load are we comfortable adding to the mix?”
- Chart type (common vs. rare) – Chart types like bar charts need lighter cognitive load than uncommon ones, like violin charts or rose diagrams and the more innovative ones.
- Interpretation (accurate vs. approximate) – Does the chart aim to deliver precise values or paint a wide picture? According to the authors, charts delivering specific values tend to take a lighter cognitive load than the ones dealing with overall objectives.
- Composition (concise vs. detailed) – This spectrum assumes a high data-ink ratio and no chartjunk (from Tufte’s concepts) are already in place and then asks, how dense is the information on the page? Less dense visualizations require lighter cognitive load.
- Delivery (explanatory vs. exploratory) – Does the data report explain itself, or is built to be explored? Exploration, naturally, takes more cognitive load than a self-explaining visualization.
How to make sense of all the previous discussions
Levers of chart-making and cognitive load as a guide are two of the recently suggested frameworks that offer a more complex approach to the task of data visualization. The two have similarities, like their consideration of complexity, granularity, and way of delivery. They differ from Tufte’s approach mainly through their acceptance of the need to slowly perceive designs in some circumstances. Cognitive load still deliberately pre-assumes applying data-ink ratio principles beforehand.
Therefore, no framework is likely to totally replace the others. At best, they tend to complement each other to cover the vast territory of the data visualization domain.
Data-ink ratio principles remain a good point to start as it best fits most business contexts. It can also help designers keep in mind the point of their design and avoid getting distracted amidst all the available software tools today. However, considering the emerging frameworks can make the practice more nuanced for tackling different needs, messages, and audiences.
The final determinant of how to incorporate the three frameworks -and any other emerging ones- in practice will remain to be the context of the visualization. A better understanding of the audience, the message, and the medium is key before using the different frameworks to decide on how information should be delivered.
Want to understand how visual representations can support the decision-making process and allow quick transmission of information? Sign up for The KPI Institute’s Data Visualization Certification course.

Tags: Data Visualization, data-ink ratio