Why use data visualization?
Data visualization is, roughly, the visual representation of information. From business executives and managers to business analysts or operations/manufacturing/supply chain managers, they all use charts, tables, histograms of other types of graphics to better visualize their data. Bar charts, line charts, scatter graphs and maps are simple examples of data visualization that have been used for decades.
The process of creating a visual representation should begin and also end with finding the purpose of the data. The question of “what story is the data communicating” should be answered before creating the visual but also before transmitting it.
Among some of the benefits of an efficient visualization we can mention:
- Action – as it empowers the process of making a good decision;
- Immediacy – as it offers immediate answers to the business related questions which might appear, helps identify patterns in the data, future trends and possible connections between various variables which can be easily spotted.
- Challenge – as it determines the brain to generate new ideas. In other words, visuals can “light the bulb”.
- Insights – as it extracts insights from previously obtained large amounts of data.
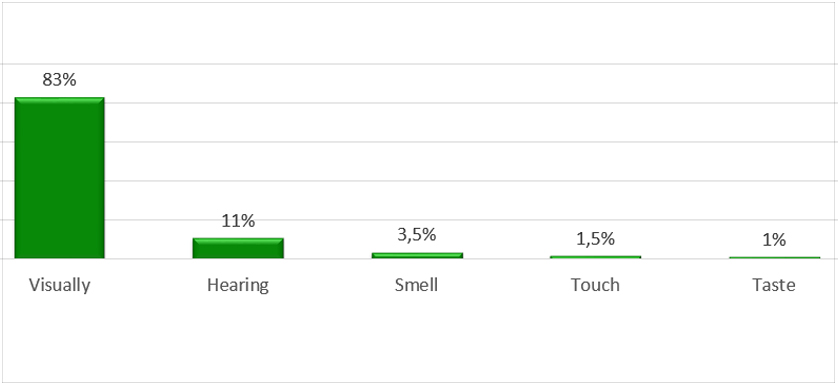
When processing visual information there are two types of memory that play an important role:
- Long-Term memory (a vast store of knowledge and a record of prior events);
- Working memory (temporary background memory for an episodic buffer).
When using the long-term memory, one expects to see the information on a visualization on X and Y axes with the corresponding unit markers, or the legend graph besides it. This type of memory is formed in time by past interactions and experiences with other visualizations.
One relies on working memory to remember part of a result while solving without paper an arithmetic problem or when a number of interest on a dashboard sticks out. This type of memory splits the vast information which is visualized into smaller pieces making them much easier to remember.
But then again, sometimes it may be hard to identify a certain message of a visual representation. The cause of such situation might be due to the failure to implement best practices such as:
- Understanding the type of data used;
- Finding the relationships between different segments of the data;
- Keeping it as simple as possible;
- No pixel should be wasted.
Furthermore, because visualizations relies on data which is accurate and coordinated, it is essential to double, even triple, proof the data based on which the visualization is created. Given the case where the data is incomplete or presents faults, or the data sets vary in definition or measurement units, the final visual may lead to a deprived interpretation of the results, which may cause a misleading or faulty conclusion. Even in the case where the data is consistent, a poorly developed visual might provide no insight or highlight inappropriate facts.
Therefore, beginning and ending with the question “what is the story of the data” in combination with an understandable and simple design can result in the creation of a visual representation worth a thousand words.
References:
Image Source:
Tags: Ask the Experts, Data Visualization