July’s smartKPI: % Overall Equipment Effectiveness (OEE)

From over 20,600 Key Performance Indicators in our database, every month we select the most popular KPI and provide you with useful information about its calculation formula, benchmarking data, as well as on the best practices to maximize performance results. This month’s smartKPI is one of the most relevant metrics, utilized worldwide in measuring manufacturing performance – % Overall Equipment Effectiveness (OEE).
Definition
Measures the efficiency and effectiveness of a manufacturing process by aggregating in one score value the quality, speed and downtime. This index can be used to indicate the effectiveness of one production equipment or of the entire production line.
Sub-metrics
A = # Availability index (# Equipment running time / # Planned production time)
B = # Performance index ((# Ideal cycle time x # Units requested to be produced) / # Run time)
C = # Quality index ( # Units produced at quality standard / # Total units produced)
Calculation Formula: A x B x C
Another calculation formula used for % OEE is # Units produced at quality standard x # Ideal cycle time) / # Planned production time.
Limitations
Critics of % OEE question the ability of this KPI to accurately reflect on the quality perspective involved in its measurement. Moreover, by analyzing from a mathematical point of view % OEE and % Production schedule adherence, there are cases in which % OEE is high, while the other KPI is significantly low.
The influential factor in the % OEE results, in this case, is the ability to correctly define the # Units produced at quality standard. The challenge is not the count of the units, but to define what the “quality standard” includes. Quality standards usually refer to technical requirements, but if the specifications are not correlated with the customers’ needs and expectations, all is in vain.
However, this limitation is mostly related to how % OEE is used and implemented in practice, not with the metric itself.
KPI in Practice
To ensure an effective usage of this KPI, professionals should take into consideration that % OEE is a very relevant measurement for managers, but not necessarily for factory workers. To stimulate engagement and productivity among first-line employees, more granular metrics should be assigned as KPIs for their job, such as # Down time, # Units produced per hour, % Defect rates.
In terms of desired results for this KPI, the following recommendations should be analyzed:
- 100% is the result of a perfect production process. This means that there is zero defect rate among units produced, while the cycle time is as fast as possible and there are no interruptions.
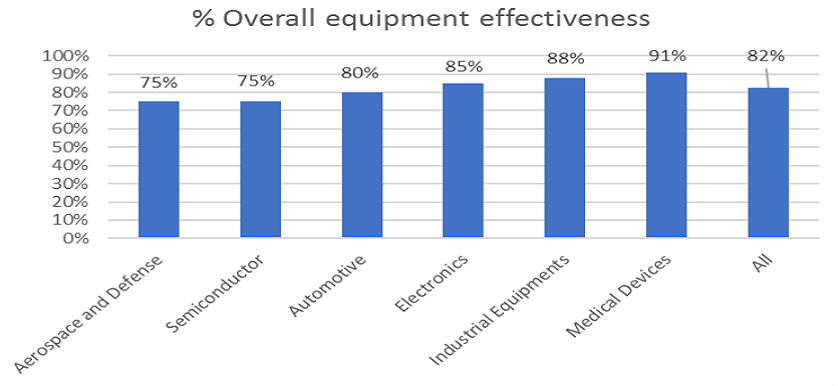
- 85% is considered world class for discrete manufacturers. This industry benchmark can become a long-term target for organizations.
- 60% is the most commonly encountered performance level among discrete manufacturers. However, there is substantial room for improvement.
- 40% is regarded usually as poor performance. It is commonly the trigger signal for companies to start focusing on process improvement. However, the root-cause analysis of such performance results can easily reveal the necessary corrective actions to address the issues in a relatively short timeframe.
When analyzing performance results, it is recommended to avoid focusing too much on the overall % OEE value and to try to look at the underlining metrics of this KPI to better understand what generates your actual results.
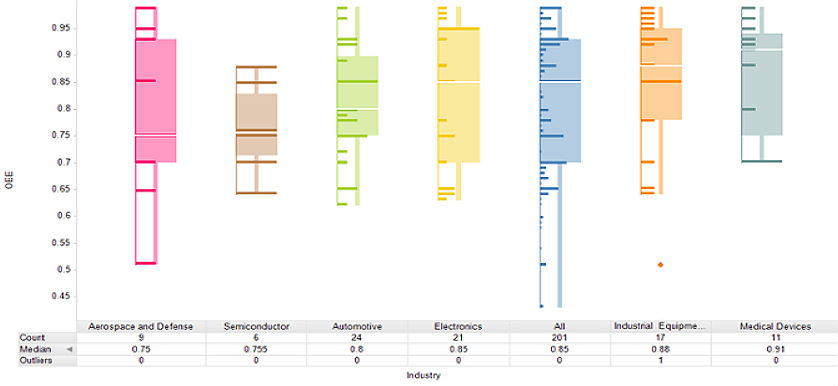
Benchmarking data
Below you can find benchmarking data from 2012 for six different industry sectors, provided by LSN Research.
 Key Performance Drivers
To drive performance improvement from the usage of this KPI, it is important to disseminate the performance results in real time so that corrective actions can be taken on a daily basis in order to maintain adequate levels of % OEE.
Given the computation of this KPI, there are a variety of factors that can influence performance results. For example, both # Availability and # Quality are influenced by the quality of maintenance services and by the proper performance levels of the equipment used.
Moreover, quality is also influenced by a series of other factors related to the manufacturing environment or by the supply chain. If raw materials do not meet quality standards, producing high quality final products is difficult, if not impossible. To reduce the impact of these factors consider the following recommendations to be implemented at plant floor level:
- Ensure that clear and proper work instructions are followed by workers;
- Adequate work tools (equipment) are available during assembly or production;
- Correct measurements and checks are deployed to verify quality levels at every crucial step in the process;
- All required production information (marking each piece, tracking down row materials in each piece) is accurately handled.
Other manufacturing KPIs can be found in The Production and Quality Management Dictionary, one of The KPI Institute’s most popular publications. The dictionary provides a collection of the most common KPIs in the production and quality sector, combining input fromthe smartKPIs.com community with research and analysis from The KPI Institute’s research team.
In August, we invite you to discover our next smartKPI, which is commonly used in the IT Industry to measure and optimize performance!
Image sources:
- Pixabay
- Overall Equipment Effectiveness Benchmark Data
- Overall Equipment Effectiveness Benchmark Data

Tags: Benchmarking, KPI in Practice, Manufacturing performance, Metrics, SMART KPI