Red, yellow and green signaling in performance scorecards – Part 2 – Meaning of colors
smartKPIs.com Performance Architect update 12/2010
The previous update explored the historic journey of using red, yellow and green for performance management signaling. It illustrated how red and green traffic lights were initially used in railway signaling and gradually adopted for road traffic management. Yellow was added to the traffic light in 1920, about 50 years after the first traffic light was introduced. William Potts, a Detroit Traffic Police Superintendent designed the first 4-way, 3 color traffic light.
Yellow was introduced to signal a “caution” interval, warning of an upcoming signal change from either red to green or green to red. It was required to command greater attention from motorists as speed in intersections increased and the breaking required more time and advance notice (Lamm, 2010). Yellow is a high visibility color that works well with road traffic signaling and is well positioned half way between the red and green light spectrum.
Gradually red, yellow and green signaling started to be used in business environments, to signal stock prices variances (red and green) and variations in performance reports. Besides their light wavelength properties, there are additional meanings and properties that popular culture and research associated with these colors.
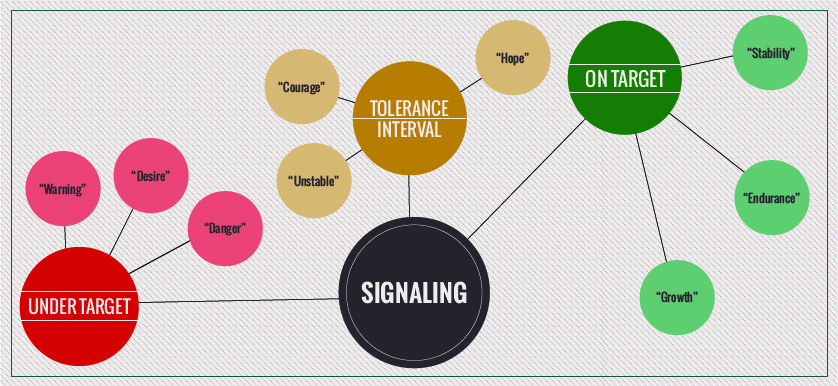
- Red: glowing, energy, confidence, alive, purity, good luck, passion, desire, love, excitement, danger, warning, war, stop.
- Yellow: sunshine, warm, exciting, happy, hope, courage, unstable, spontaneous, attention getter.
- Green: peace, stillness, nature, growth, harmony, freshness, safety, restful, stability, endurance.
In performance management, the meaning of these colors are:
- Red: Results are under the established target and require urgent attention.
- Yellow: Results are under the established target, but within a tolerance interval. They need to be analyzed and monitored.
- Green: Results are on or over the established target.
When using such performance variance intervals, an important aspect that needs to be addressed before reporting is the values for each interval. What value of results “makes” them yellow or red? The steps to be followed are:
- Establishment of the performance target for the measure.
- Decision if a standardized variance interval will be used for all measures or if a customized variance interval will be used for each. An example for the first option is: all measures with results between 80-99% of the target are labeled as yellow. An example for the second option is: for measure a and be the tolerance interval is 90-99%, while for measure c and d it is 70-99%.
- Establishment of tolerance intervals for each measure. This is a simple process if the same standard is adopted at step 2 or more time consuming if different tolerance intervals are established as part of step 2.
For qualitative measures, the performance variance intervals are defined by establishing what performance standards are required for each of the colors illustrating performance results.
The use of colors has thousands of years of tradition, however in terms of business and performance reporting, perhaps we are still in the early stages of working with color. Nevertheless, color enhances performance reports and with an increase emphasis on data visualization, it is just a matter of time until innovations in this area will start to emerge. After all it took over 50 years to add a new color to road traffic light signaling.
Stay smart! Enjoy smartKPIs.com!
Aurel Brudan
Performance Architect,
References- Lamm W., 2010, History of Traffic Signal Design, accessed on 26 March 2010.

Tags: Aurel Brudan, Performance Architect Update, Scorecard, Traffic Light