Performance Management – a story told through key survey figures and statistics
smartKPIs.com Performance Architect update 20/2010
Performance Management is one of the most dynamic business disciplines today. Its evolution accelerated over the last 20 years and due to the large number of concepts it employs and unstructured body of knowledge, having a comprehensive big picture view of the topic is rather challenging. One way of achieving this is by reading a lot and doing a critical review to the various ideas proposed. Another option is by monitoring the pulse of the discipline as reflected in studies and survey reports covering performance management topics.
Listed below is a random list of relevant statistics published in performance management studies over the last few years. It is interesting to put them together as pieces in a puzzle, to create a picture of the state of the discipline. This is the plus. On the other hand, each study used different research tools and varied in rigor, so the results need to be analyzed in the context of the survey as illustrated in the original report.
Overall they form an interesting read and while the degree of accuracy for their findings may vary, they can be useful in understanding the thinking and direction in Performance Management research and practice:
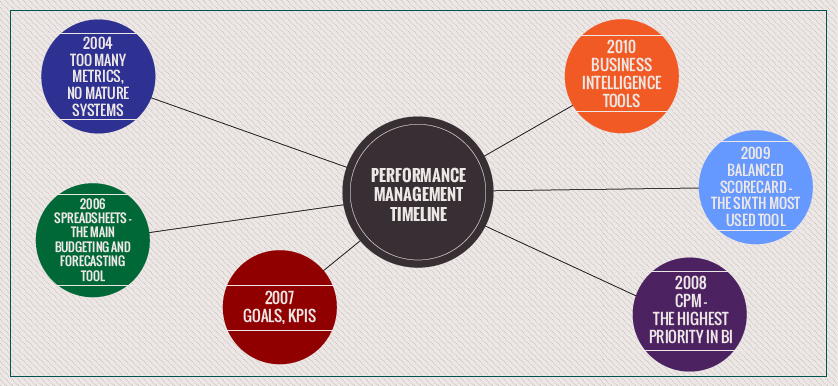
2010- ” …the most growth in BI [Business Intelligence] tools to support performance management has been in operations (51%), finance (50%) and customer management (49%) ” (Ventana Research, 2010)
- ” …more than half of participants (53%) said that they are only somewhat confident or not confident at all that their BI [Business intelligence] technology meets the needs of the organization”…. with only 9% being “very satisfied with their organization’s BI efforts.” (Ventana Research, 2010)
- “…lack of resources (60%) and lack of a budget (43%) are the two most common barriers to improving BI and performance management…. The top two people issues are lack of awareness (36%) and lack of executive support (26%)” (Ventana Research, 2010)
- “…41% of participating organizations evaluate performance data and 29% are assessing metrics or measures to do so.” (Ventana Research, 2010)
- “…two thirds (66%) of organizations are planning to evaluate new technologies for BI and performance management.” (Ventana Research, 2010)
- Balanced Scorecard is the sixth most used management tool all over the world. (Bain & Company, 2009)
- 53% of the surveyed companies use a Balanced Scorecard, with an overall satisfaction score of 3,83 from 5. (Bain & Company, 2009)
- “ On average, 84% of employees at Best in Class organizations were rated “meets” or “exceeds” performance expectations…” (Aberdeen Group, 2009)
- “… An [Enterprise Performance Management] EPM system with strong reporting capabilities is a critical enabler for the Best in Class (companies) by enabling leaders and managers to make better decisions…” (Aberdeen Group, 2009)
- “Most of the companies agree that systemically deriving KPIs from their strategy and effectively communicating that strategy are crucial to ensuring strategic objectives are met” (PricewaterhouseCoopers, 2009)
- “….only 33% have implemented strategy maps. Nevertheless 67% of the companies use strategy development tools such as value chain analysis.” (PricewaterhouseCoopers, 2009)
- ” While many companies say they derive KPIs from strategy (61%), a smaller number indicate that they have been through the process of defining strategic value drivers (54%) to break strategy and identify relevant KPIs.” (PricewaterhouseCoopers, 2009)
- “On a scale of 1 (not integrated) to 6 (fully integrated), 73% of the companies rate their [Performance Management] process integration as a 4 or above.” (PricewaterhouseCoopers, 2009)
- “…many companies focus on classic financial control measures. 81% stated that they use KPIs concerning profit or loss, liquidity, profitability and operational business.” (PricewaterhouseCoopers, 2009)
- ” …along financial indicators, 51% of the participating companies explicitly indicated non-financial measures like customer satisfaction or quality of delivered services as KPIs in use” (PricewaterhouseCoopers, 2009)
- “On average more than 80% of companies think their [Performance Management] PM processes need improvement…the planning, budgeting and forecasting processes seem to be especially problematic” (BARC, 2009)
- ” ..the number of people involved in performance management processes has increased over the last years with an average of 30% across all [Performance Management] PM processes.” (BARC, 2009)
- “ Corporate performance management (CPM) is the highest priority in business intelligence (BI)…” (Gartner, 2008)
- ‘’….through 2011, at least 50% of companies implementing CPM will simply automate existing finance oriented processes and fail to improve performance management processes across the organization.” (Gartner, 2008)
- “……organizations that allowed their finance function to lead a CPM implementation were on average 25% less mature in their use of CPM than organizations that had an equal partnership between finance, IT and Key business users in their CPM project.” (Gartner, 2008)
- [Global Market] “….financial measures still dominate. In every country, financial measures are the most frequently measured and over half of those surveyed report that over 50% of their measures are financial” (Neely et al. 2008)
- [Chinese Market] “… 89% reported that they had adopted a formal structure for their enterprise performance management system.” (Neely et al. 2008)
- [Japanese Market] “According to data over 60% of Japanese companies have now adopted performance management frameworks such as the balanced scorecard.” (Neely et al. 2008)
- [U.K. Market] ” … only 17.3% believe they have the right number of measures, while 38.6% have concerns about the quality of their data.” (Neely et al. 2008)
- [U.S. Market] ” Despite the abundant literature on mapping strategies, the majority of the respondents, 62%, do not visualize their strategies.” (Neely et al. 2008)
- [Australian Market] “…65.5% of the respondents claim to have a balanced scorecard….. no other framework for enterprise performance management design being prominent in Australia, with 39.3% of respondents preferring to use their own basis for designing their enterprise performance management system.” (Neely et al. 2008)
- Measuring performance against goals and tracking KPIs occur in 80% of companies. (SAS, 2007)
- “8 in 10 organizations in this research are engaged in measuring performance against goals, ahead of summarizing and consolidating information. Three-quarters are tracking key performance indicators (KPIs)”:
• Performance measures against goals – 81%
• Summarized reporting of financial performance information on department level – 78%
• Key performance indicators tracked – 76%
• Decision making based on understanding of which measures drive the business – 64% (SAS, 2007)
- Benefits achieved based on performance management activities
• Competitive advantage: up to 63%
• Agility: up to 56%
• Compliance/Governance: up to 50%
• Budget/plan aligned with strategy: up to 47%
• Revenue growth: up to 47%
• Innovation: up to 44%
• Strategic alignment: up to 44%
• Response to market threats/risks: up to 41%
• Resource alignment/optimization: up to 38%
• Financial transparency: up to 38% (SAS, 2007)
2006- “In an evaluation of their budgeting, forecasting, and reporting processes, an astonishing 60% of companies surveyed exhibited limited adoption of [Business Performance Management] BPM best practices, 36% showed ‘some adoption’ while less than 4% showed strong adoption.” (Active Planning, 2006)
- “Across all companies, 78% of respondents are still using spreadsheets as their primary budgeting and forecasting tool…..only 41% are using graphical dashboards or scorecards in their reporting processes…..and fully 76% have not rebuilt their planning model in over a year” (Active Planning, 2006)
- “Average companies include nearly nine times too many metrics, focus heavily on historical finance data and not enough on forward-looking indicators.” (Hackett Group (2004) as cited by PMA, 2005)
- “Less than 20% of all typical companies have mature balanced scorecard implementations in place that are generating business value.” (Hackett Group (2004) as cited by PMA, 2005)
- “…..world class companies are 159% more likely….. than typical companies to have mature balanced scorecards” (Hackett Group (2004) as cited by PMA, 2005)
- “…companies report an average of 132 measures to senior management each month (83 financial and 49 operational). This is nearly nine times the number of measures suggested as appropriate when the concept of the balanced scorecard was introduced in 1992″ (Hackett Group (2004) as cited by PMA, 2005)
Same as in Performance Management, “seeing beyond figures” makes the interpretation and use of such results more balanced and relevant.
Stay smart! Enjoy smartKPIs.com!
Aurel Brudan
Performance Architect, www.smartKPIs.com
References:
- Aberdeen Group 2009, Research Brief, SuccessFactors: Addressing the Pillars of Employee Performance Management Success
- Adaptive Planning 2006, Press releases: Mountain View, CA, December 11, 2006, Business Performance Management Survey Reveals 60% of Finance Departments Have Not Adopted Best Practices
- Bain & Company 2009, Management Tools 2009. An Executive’s Guide by Darrell K. Rigby
- Business Application Research Center (BARC) 2009, Performance Management – Current Challenges and Future Directions. A global survey
- Gartner 2008, Press Releases: Egham, UK, February 6, 2008 – Gartner Survey shows Corporate Performance Management is the highest priority in Business Intelligence in Europe
- Hackett Group Research, Performance Measurement Association (PMA), 2005 Perspectives on Performance, Volume 4, Issue 1, pp 3
- Neely, A.D.; Yaghi, B. and Youell, N. (2008) “Enterprise Performance Management: The Global State of the Art”, Oracle and Cranfield School of Management
- Neely, A.D.; Cuganesan, S; Yaghi, B. and Youell, N. (2008) “Enterprise Performance Management: The Australian State of the Art”, Oracle, Macquarie University and Cranfield School of Management
- Neely, A.D.;Yaghi, B.; Dietrich, R. and Youell, N. (2008) “Enterprise Performance Management: The US State of the Art”, Oracle, Fisher College of Business and Cranfield School of Management
- Neely, A.D.; Yaghi, B. and Youell, N. (2008) “Enterprise Performance Management: The UK State of the Art”, Oracle and Cranfield School of Management
- Neely, A.D.; Shimizu, T.; Yaghi, B. and Youell, N. (2008) “Enterprise Performance Management: The Japanese State of the Art”, Oracle, Waseda University and Cranfield School of Management
- Neely, A.D.; Yaghi, B.; Zhijun Wang, Z. and Youell, N. (2008) “Enterprise Performance Management: The Chinese State of the Art”, Oracle, Peking University and Cranfield School of Management
- PricewaterhouseCoopers 2009, European Corporate Performance Management Survey
- SAS 2007, The Truth About Performance Management – A Report of Survey Findings
- Ventana Research 2010, Business Intelligence and Performance Management for the 21st Century

Tags: Aurel Brudan, History, Performance Architect Update, Performance Management, statistics