Marketing Performance – a review on instruments and models (I)
Marketing as a discipline has benefited from the contribution of a great number of thinkers, both academics and practitioners. They have proposed several theories, models and instruments studied and used by people and organizations worldwide.
The volume of such theories and instruments is quite impressive and, despite their great recognition, it sometimes happens that companies forget to resort from time to time to such simple, yet effective exercises of performance analysis.
In this blog post, we will focus on two marketing instruments used in product analysis and positioning. Future posts will explore more wide-known models used in this context.
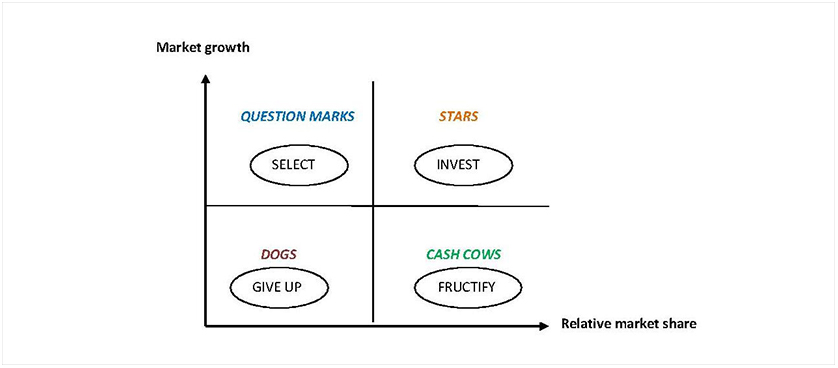
The first instrument analyzed is the Boston Consulting Group (BCG) matrix.
This instrument is useful for companies that possess a portfolio of products and want to evaluate the performance of each of the product it commercializes. It is called a “matrix” because it is based on a diagram with two axes, one representing the market growth and the other the product’s relative share in that market (see figure below).
The result is that the company’s portfolio of products is divided into four sub-components, each of them reflecting the product’s position based on its performance. Depending on where the product is situated, the company has to make strategic decisions on what to do next with it. For example, it must select the “question marks” based on their potential and invest on the ones that are the most promising. On the other hand, it has to decide what to do with the low-performing “dogs”, most of the times giving up on further on commercializing them. It is argued that in order to insure long-term value creation, the company portfolio must contain both high-growth products that need cash inflows and low-growth products that generate the cash needed to invest in them (Value Based Management.net, 2010).
The second instrument is the Positioning Map.
This is also a graphic representation of how your product is perceived by customers by comparison to other competing products. The Euclidean space that represents the market is divided into four sub-spaces, commonly based on a pair of attributes (such as quality and price, performance and design etc.):

Although it is highly subjective (i.e. it is also called perceptual map, as it is based on consumer’s perceptions on the brands), it can help in positioning the product relative to the competition and selecting which positioning areas to enter and the competitors to compete against. Also, it reflects the product’s or the brand’s performance in positioning itself as it desires in the marketplace, both in the consumer’s minds and in relation to competitors.
Stay on smartKPIs.com for new suggestions of marketing instruments and methods to use in order to analyze and raise the performance of your brand and your organization.
References:

Tags: Marketing performance, Perceptual Maps, Positioning Maps, Theory