How to set yellow thresholds for targets? – Insights from Balanced Scorecard Forum 2011 FAQs
Balanced Scorecard Forum 2011 in Dubai generated an environment of intense interaction between participants, speakers and facilitators, giving the opportunity to address questions that for many delegates represented obstacles in implementing or utilizing Balanced Scorecard within the organization.
Starting with the first day of the Forum, a frequently asked question was raised in the Pre-Forum Workshop A – Executing Strategy with the Balanced Scorecard, facilitated by Aldo Labaki & Roberto Wyszkowski, Palladium UAE: “How to set yellow thresholds for targets?”. In practice, as expressed by the delegates, it is highly interpretable and debatable among the employees that set and have to achieve the target. The facilitators mentioned that this issue has been raised with many occasions, however, a generic answer has not yet been agreed upon at international level. An option mentioned during the workshop was the following:
- Blue (or gold) – for achieving >95% of the target;
- Green – for achieving 75%-95% of the target;
- Yellow – for achieving 60%-75% of the target;
- Red – for achieving <60% of the target.
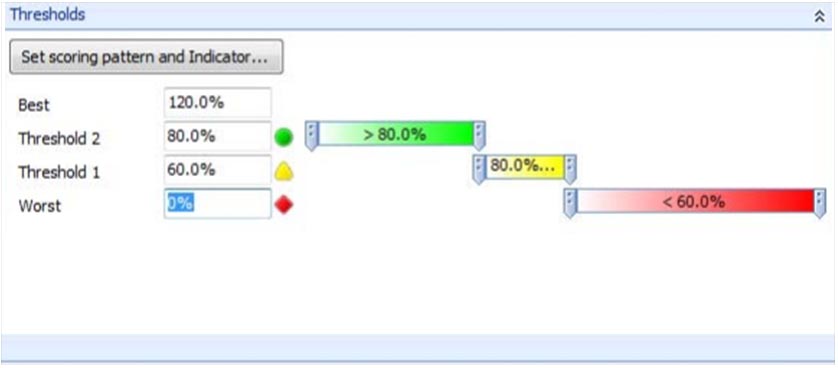
Various answers to this question raise a continuous debate on how to set thresholds for the targets of KPIs. For example, dashboard and scorecard users may offer different color coding of thresholds (Facca, Jozlin, Spears & Ward, 2009), such as: green (>80% of target), yellow (60%-80% of target), or red (<60% of target).
When reviewing KPIs, color signals, are used to visualize the difference between the current situation when it is compared to the desired outcomes. This is an effective tool for communication. Red signals visualize that immediate action is necessary, while yellow is used to express that close attention is needed. Green is used when the relationship between current and target measures are satisfying (smartKPIs.com, 2011).
smartKPIs Premium service offers access to a section dedicated to examples of thresholds set for each documented KPI, as our belief is that thresholds need to be customized according to the reality of each organization.
References:
- Facca, N., Jozlin, B., Spears, S. & Ward, J. (2009), PerformancePoint Tutorial
- smartKPIs.com (2011), On Key Performance Indicators (KPIs)
Image Source:
- Facca, Jozlin, Spears & Ward (2009)

Tags: KPI, Targets, Thresholds