How to design effective dashboards?

Designing an individual graph may prove difficult to a certain extent. The degree of difficulty increases considerably when faced with the challenge of designing a dashboard. This is because a dashboard combines a large collection of information, often dissimilar, which can easily become cluttered.
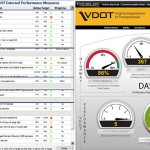
Yet, dashboards are, by definition, a visual interface that provides at-a-glance insight into key measures that are relevant to a particular objective or business process. A dashboard has three key attributes:
– It displays data graphically;
– It only displays data that is relevant to the dashboard’s purpose ;
– It contains predefined conclusions relevant to the dashboard’s purpose and relieves the reader from having to perform his own analysis.
Before starting to design a dashboard, regardless of what its objective might be, a prime key step will be to collect user requirements. These user requirements include defining your audience, data sources, key performance indicators (KPIs), refreshing schedules, data governance, and so on.
As dashboards can be effective and can provide the user with the required information, the question becomes: How can you design a dashboard that works for you?
There are several best practices that need to be taken into consideration when designing a dashboard.
- Choosing the KPIs that matter
A first consideration when designing a dashboard is to identify and choose the metrics that really matter out of the vast sea of metrics. For selecting the few metrics that have the privilege of occupying a spot on the dashboard, some questions need to be answered, such as:
– How does the metric contribute to the purpose of the dashboard?
– Can the data, either internal or external, shed light on the monitored processes?
– Can the metric be designed to measure those contributions?
– Can the metric be built as a systematic and on-going means of measurement?
- Keep it visual
To enhance the viewer’s information absorption, when displaying the information in a visual manner, rather than number-based tables or text, the dashboard could be enhanced through increasing the speed with which data is comprehended by others. It also provides an aid in making a decision.
Some of the most common visuals used in dashboards are bar graphs, line graphs, heat maps, scatterplots that have a bigger impact on the viewer, mainly because they are clear and people know how to read them.
Also when designing dashboards, emphasize on the use of colors, shapes, lines, thickness, and other precognitive attributes that our brain instantly recognizes.
- Allow users to explore
A step further in designing an effective dashboard, provided that it already has relevant metrics and is visually engaging, is to offer the opportunity for the viewer to deep dive in the presented data. As everybody is looking at the metrics’ visual representation, each person may have unique questions about what they see. Therefore, create the dashboard in a manner that allows users to interact with it and get the answers they seek.
There are numerous possibilities for this, like the option to filter views, adjust parameters or to provide historical overview.
- Update regularly
Ensure that the metrics which deserve a spot on the dashboard are constantly and correctly updated to reflect current business results.
An effective dashboard allows viewers to make faster and smarter decisions. These decisions are based on the data presented in the dashboards which, if outdated, are no longer representative or relevant for the current situation.
References:
- Few, S. (2006), Dashboard design for rich and rapid monitoring
- Few, S. (2006), Information dashboard design
- Alexander, M. and Walkenbach, J. (2013), Excel dashboards and reports

Tags: Ask the Experts, Dashboard, Performance Measurement


Performance Magazine Embracing Data Visualization: What Is a Self-service BI System?
| #
[…] should be, however, distinguished from the second approach called dashboarding. While the latter should still be the responsibility of the experienced BI team, turning amounts of […]
Reply