Gartner releases its 2017 Magic Quadrant for BI and analytics platforms
February of 2017 marked the release of a year-long expected report, the Magic Quadrant for Business Intelligence and Analytics Platforms published by Gartner.
In 2016, Gartner redesigned the Magic Quadrant for BI and analytics platforms to reflect a new, more modern, user-centric business perspective, compared to the older IT-defined enterprises. Now, in 2017, there is evidence“that the BI and analytics platform market’s multiyear transition to modern agile business-led analytics is now mainstream.”
“Reduced feature differentiation among a crowded market of players, buyer requirements for larger enterprise deployments, and the emergence pricing pressure are evidence of the maturity of the current market.”
The Gartner team underlines the importance of the Magic Quadrant as it focuses on products that meet the criteria of a modern BI and analytics platform, which are driving the majority of net new mainstream purchases in the market today.
Platform leaders
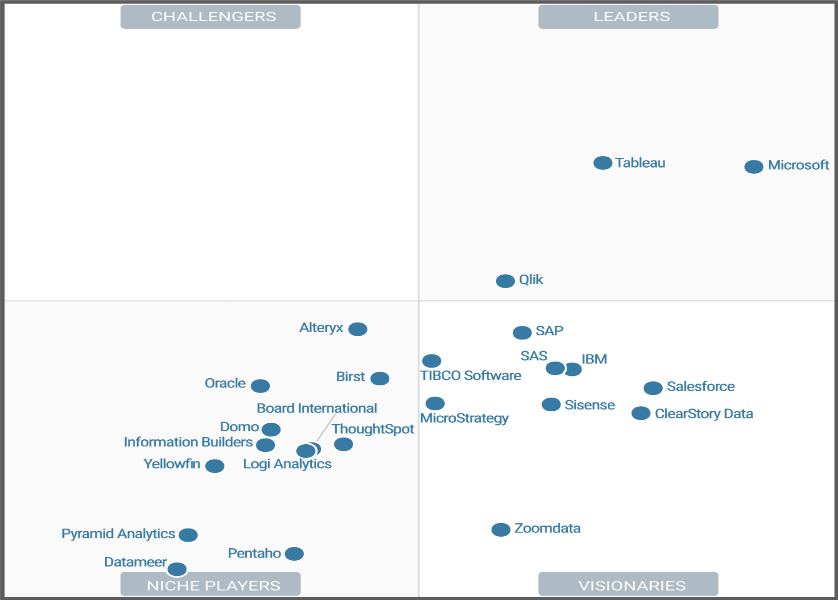
Just like last year, the leaders in Gartner’s Magic Quadrant are Microsoft, Qlik and Tableau. The quadrant ranks the BI and analytics platforms based on their ability to execute – as is measured on the vertical, Y axis, correlated with their completeness of vision – as shown on the horizontal, X axis, among other measurement variables.
Magic Quadrant ranking indicators
Gartner uses a series of ranking variables which are called “use cases”. Analytics vendors, such as the above mentioned ones, are assessed for their support of five main use cases:
- Agile Centralized BI Provisioning
Supports an agile IT-enabled workflow, from data to centrally delivered and managed analytic content, using the self-contained data management capabilities of the platform.
- Decentralized Analytics
Supports a workflow from data to self-service analytics. Includes analytics for individual business units and users.
- Governed Data Discovery
Supports a workflow from data to self-service analytics to SOR, IT-managed content with governance, reusability and promotability of user-generated content to certified SOR data and analytics content.
- OEM or Embedded BI
Supports a workflow from data to embedded BI content in a process or application.
- Extranet Deployment
Supports a workflow similar to agile centralized BI provisioning for the external customer or, in the public sector, citizen access to analytic content.
Future trends
Finally, the Gartner report isolated the BI and analytics platforms trends for the near future. According to them, by 2020:
– “smart, governed, Hadoop/Spark-, search- and visual-based data discovery capabilities” will merge into a single group of next-generation data discovery capabilities as components of modern BI and analytics platforms;
– 90% of modern BI platforms will have a natural-language generation and artificial intelligence feature;
– 50% of analytic queries will be generated using search, natural-language processing or voice, or will be auto-generated;
– the number of citizen data scientists will grow five times faster than the number of data scientists.
What is more, by 2021, “the number of users of modern BI and analytics platforms that are differentiated by smart data discovery capabilities will grow at twice the rate of those that are not, and will deliver twice the business value.”
Image source:

Tags: Analytics, Business Intelligence, Magic Quadrant
Related Posts
 Gartner releases its 2016 Magic Quadrant for BI and analytics platforms
 Gartner releases its 2018-19 Magic Quadrant for BI & analytics
 The 2014 trends in software solutions. Magic Quadrant for Business Intelligence and Analytics Platforms
 The 2015 trends in software solutions. Magic Quadrant for Business Intelligence and Analytics Platforms

