Financial Performance Benchmarking within the Gas Utilities Companies
The extensive secondary benchmarking initiative launched in 2016 by The KPI Institute, through its Center for Performance Benchmarking and Utilities Performance Labs, consists of 6 individual reports; 2 reports for each of the 3 utilities sectors- water, gas and electricity. The fifth report of the Utilities Performance Benchmarking Report Series 2017, “Financial Key Performance Indicators for Gas Utilities” provides a detailed analysis of the financial indicators monitored by gas providers. This report includes data from 31 gas utilities located in 13 countries situated on 5 continents.
The companies were chosen to the extent of showcasing the level of financial performance from different world regions as geographical matters can influence to a certain extend the operations and the geographical coverage of utilities companies. Moreover, to enable comparisons for a wide range of companies, the report includes companies with different structures in terms of size, number of employees or departments.
Financial gains surely are on top of priorities for all for-profit companies, independent of the sector they activate in. While for the non-financial indicators companies have more flexibility in regards to what they monitor and measure, in terms of financial KPIs, the performance management framework in place is more stable, hence most companies measure similar KPIs, facilitating comparison among companies through a benchmarking initiative.
The aim of the Utilities Performance Benchmarking Report Series 2017 is to enable professionals to activate new KPIs within their utilities organizations based on their usefulness for other companies from the sector, to help them set targets for the newly activated KPIs or to facilitate the comparison of the results for organizations that already measure those indicators.
The 18 key performance indicators included in the report were structured into a comprehensive framework consisting of 5 clusters further divided in sub-clusters if the case. The KPIs contained by the report were selected by the specialists from The KPI Institute based on their experience and based on an initial market analysis.
A) The first cluster, Assets and Liabilities is divided in two main sub-cluster: Assets, showcasing expected financial benefits within one year, and Liabilities, reflecting on the expected debt within one year.
Out of the five indicators included in the cluster, we found that $ Non-current assets and $ Current liabilities are the two financial KPIs monitored and reported by the majority of the gas utilities company included in the report, as shown in the histograms below:
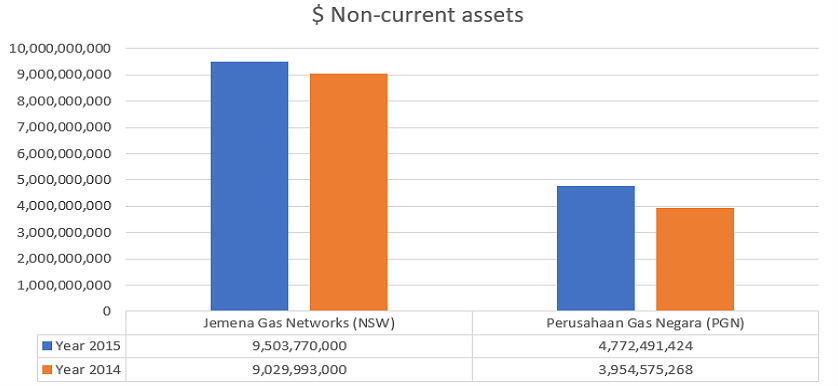
- $ Non-current assets measures the value of long-term resources controlled by an organization because of past activities, that are expected to generate economic benefits in the long-term, generally after more than one fiscal year.
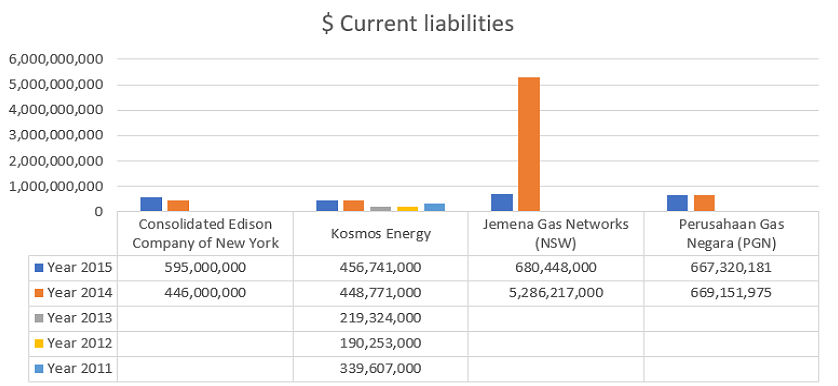
- $ Current liabilities measures the value of an organization’s debts or obligations towards a creditors or suppliers, from past events or transactions, that appear on the company’s balance sheet and are due within one fiscal year.
B) The Revenue and Costs cluster includes four financial KPIs, which reflect on the cash flow of the gas utilities company. For instance, concerning gas organizations, we have noticed that $ Net cash flow from operating activities and $ Working capital are the KPIs used more frequently for measuring the costs the company faces.
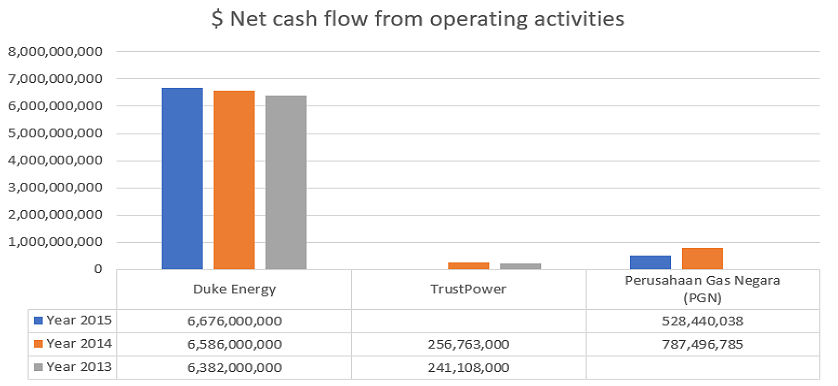
- $ Net cash flow from operating activities measures the quantity of cash generated from the normal operating processes of a business during one fiscal year.
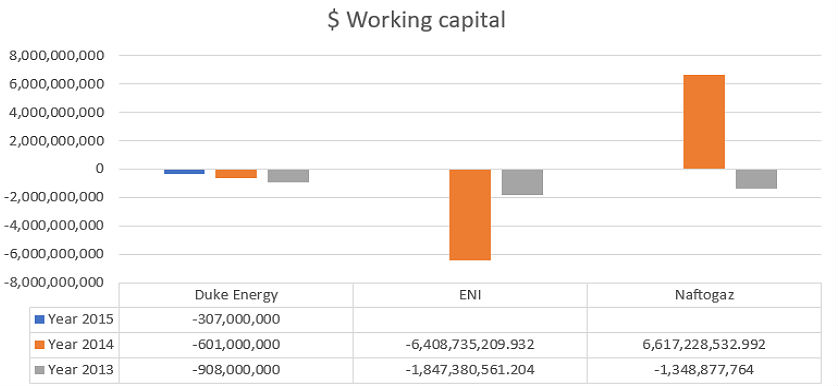
- $ Working capital measures the company short term assets availability used to cover short term obligations and debt. It is commonly used to assess short-term financial health.
C) The third cluster, Profitability, pinpoints through four main KPIs, on the financial performance and earnings of gas utilities. The most representative example of KPI in practice seems to be $ Gross Profit.
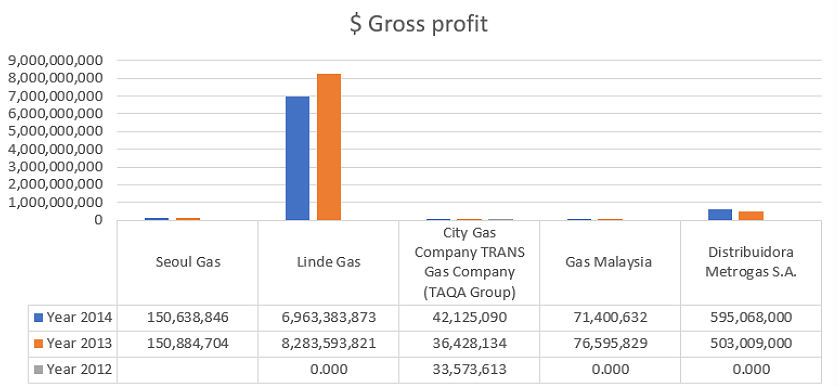
- $ Gross profit measures the total quantity of total revenue obtained from services and products minus the costs associated with extraction and distribution of gas to both industrial and households.
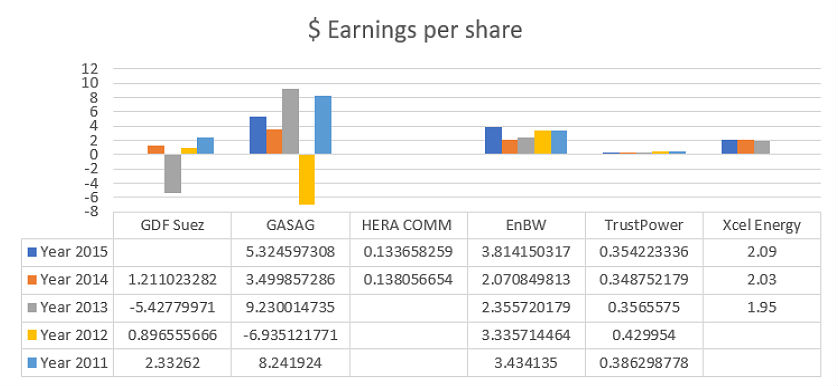
D) The Shareholder’s Profitability cluster, analyzes two financial KPIs related to gains for the organization’s shareholders. For instance, $ Earnings per share indicates the portion of a company’s profit allocated to each outstanding share of common stock. This financial indicator is used to indicate a company’s profitability.
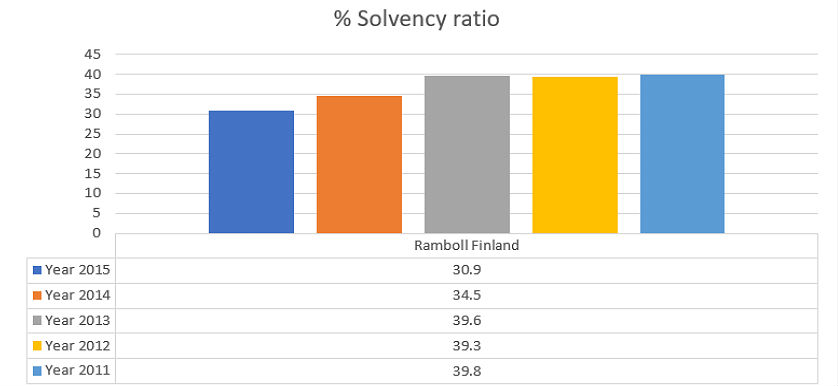
E) The Financial Stability cluster, analyzes three financial KPIs that reflects on the organization’s ability to pay its short and long-term obligations. % Solvency ratio, is frequently monitored and reported in practice, with the objective of showcasing the financial stability of an organizations as it measures the capability of a company to meet its debt and other short-term obligations. Generally, the lower a company’s solvency ratio, the greater the probability of default.
To accurately analyze and exploit the benefits of a benchmarking initiatives, let’s make an example with $ Gross profit indicator. In the hologram above we have data for five companies located in 4 continents:
- Seoul Gas – about 600 employees
- Linde Gas – about 3000 employees
- City Gas Company – TRANS Gas Company (TAQA Group) – about 3000 employees
- Gas Malaysia – about 355 employees
- Distribudora Metrogas – about 2550 employees
Based on the characteristics of the organization, starting from the size of the workforce along with additional information as number of customers served and geographical coverage, we can find the most suitable benchmarking partner(s). Consider, for instance that our company has around 2700 employees and it operates mainly in the Middle East-South East Asia areas, at first glance, the most representative benchmark partner for us would be City Gas Company – TAQA Group.
Image source:
Tags: Key Performance Indicators, KPI, Oil and Gas performance, Report Analysis